New Errors
Introduction
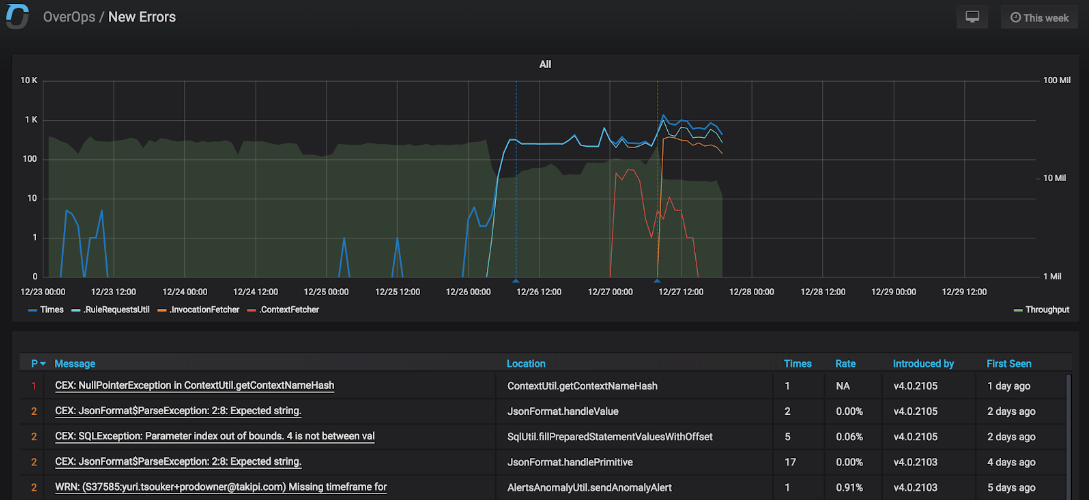
The New Errors dashboard shows a list of newly detected errors within the selected timeframe. Severity levels are assigned to each error based on its type, volume and rate.
Learn how OverOps Calculates the Reliability ScoreClick here for a visual overview of the OverOps dashboards, and the way they all connect to provide QA, DevOps and SRE teams a complete picture of application reliability across multiple environments.
If a new error is uncaught or it is an exception of a type that is contained within the critical_exception_types comma delimited list defined within the Settings Dashboard it is automatically categorized as severe. If the error’s volume has exceeded the value defined in the error_min_volume_threshold within the Settings dashboard AND is relative rate (i.e. the ratio between the event’s volume and calls into its containing method) exceeds the value set in the error_min_rate_threshold within the Settings dashboard the event is also considered severe.
Clicking each error name in the table will jump to the OverOps Automated Root Cause (ARC) analysis for this error that will show exactly the complete state of the event at the moment where it exceeded the threshold. This enables developers and SREs to see the actual state within the application that caused that error to understand whether the cause of the error is code or infrastructure related.
Additional Information
- Clicking one of the top indicators takes you to the Errors-drill down Dashboard, which provides a zoom into an event type.
- The indicators (top boxes) enable easy filtering according to important event types: uncaught, critical, HTTP Error, and log error.
- All errors are ranked in the dashboard.
New Errors Dashboard JSON ModelCustomize the dashboard, or integrate any of the widgets in it into your Grafana using the Grafana JSON Model of this dashboard.
Updated about 1 year ago