Connect External Grafana Instances to OverOps
Introduction
Grafrana dashboards are built into the OverOps solution, and come installed out-of-the-box. If you wish to connect an external Grafana instance, follow the steps below and then restart your backend.
Connecting Grafana to OverOps
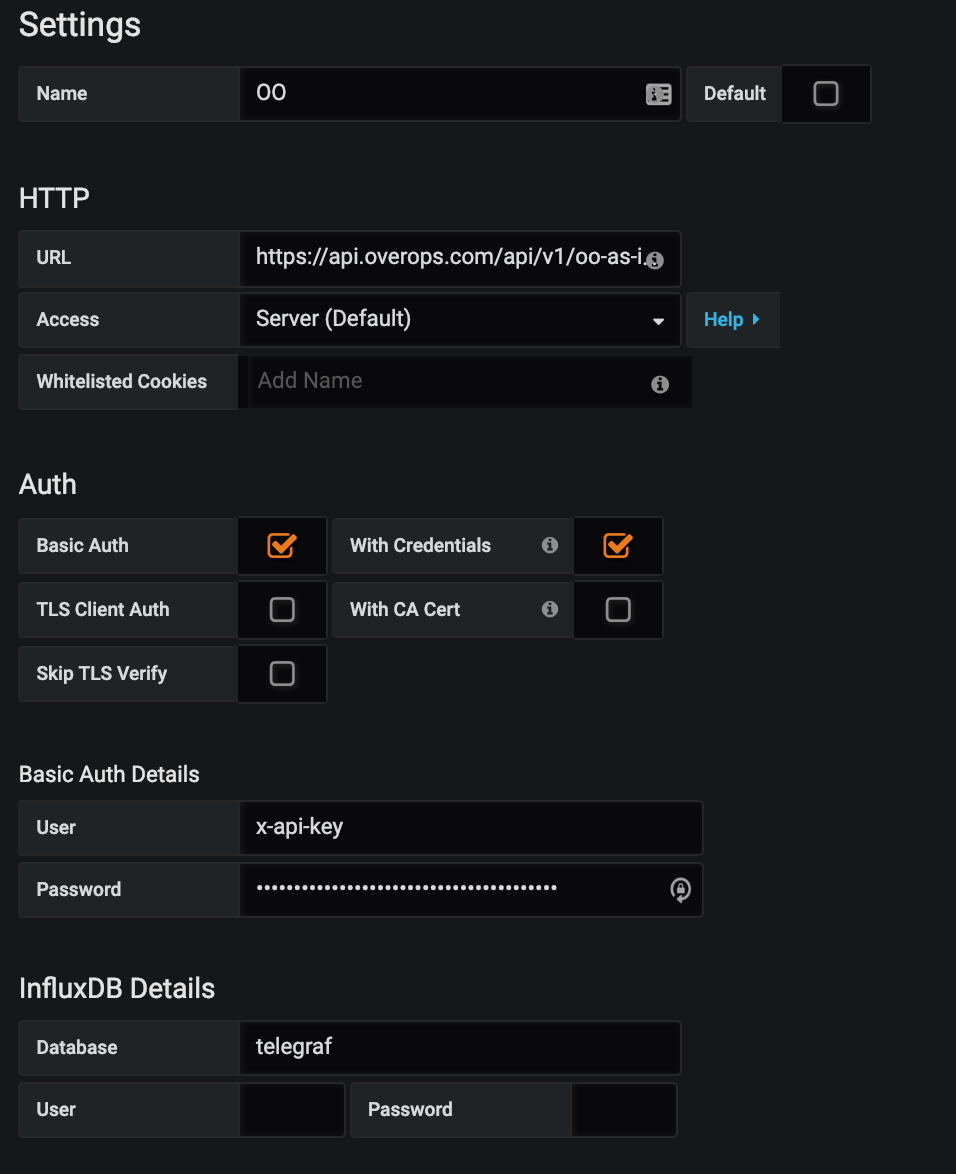
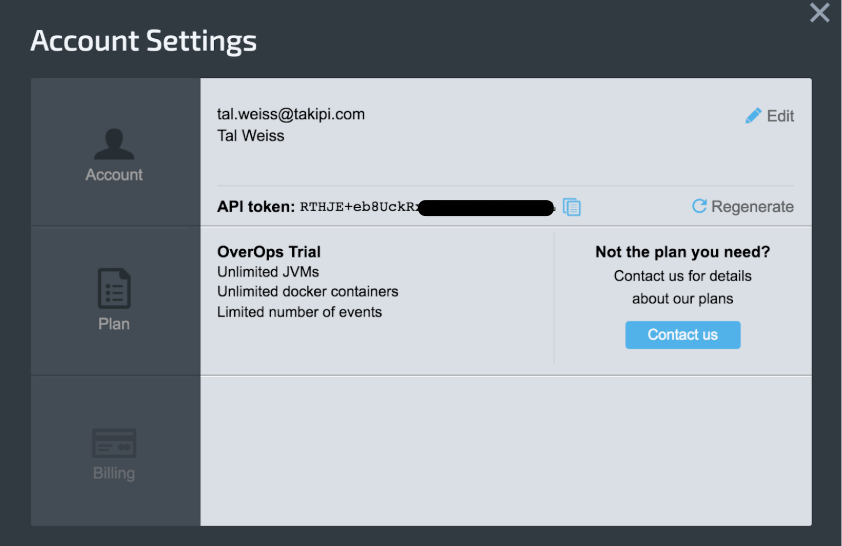
The first stage for connecting your Grafana instance to your OverOps SaaS or on-premises server is by defining a Grafana datasource which points the Grafana instance to the OverOps server. This is done by creating a new InfluxDB data source called "OO" and set the HTTP URL to https://api.overops.com/api/v1/oo-as-influx, the Basic Auth Details User to "x-api-key" and the password to your OverOps REST API token, available from within the OverOps Event Explorer account screen under your User profile.

Connecting your SaaS or On-Premises Data OverOps instance to your locally installed Grafana instance as an InfluxDB datasource.

Obtaining your API key from the OverOps Account screen.
Available sample OverOps datasource json configuration files are available here: https://git.io/fhk7J
Creating OverOps-powered Grafana Dashboards
From this point any widget within Grafana (e.g graphs, tables, labels,..) can be used to visualize and alert on data collected by OverOps. This is done by using query functions. A query function is a logical OverOps function that can be invoked from within any Grafana widget in order to compute and return a result that can be then visualized by Grafana. An example of a function can be a function call to return all new events introduced by a specific release whose rate exceeds a target percentage, or return all transactions experiencing a severe slowdown within a target application or microservice. These results returned as json time series data can then be natively visualized via charts, graphs, tables, labels and more.
To assign a query function to a widget, simply add query to it, assign it to the OverOps datasource you’ve created, click “Toggle Edit mode” and enter / paste your query.

Using the Grafana widget editor to invoke an OverOps query function.
Documentation for all available query functions can be found here: https://git.io/fhkQ9.
Because users may want to create dashboards where the selected environments, applications, deployments can be selected dynamically, the OverOps Grafana backend supports Grafana template dashboards natively. With these dashboards, users can choose values dynamically (e.g. application, code tier,..) on which to compute. For this, OverOps provides a wide array of template functions that enable users to choose environments, applications, deployments, servers, views, labels, tiers, transactions, event types and more.

Template variables enable users to modify the filters they use to observe data from within the OverOos environment(s).
OverOps Out-of-the-box Dashboards
The json files for all available OverOps dashboards are available here: https://git.io/fhk7v
Enable the Reliability Dashboards Button
Next, enable the "Reliability Dashboard" button on the OverOps main page and link it to the on-prem instance of the Grafana. This will allow the end-user to jump to the Reliability Dashboards from OverOps main event explorer with the same Environment context.

- Go to the OverOps On-Premises "my.server.properties" configuration file (under the /opt/takipi-server/conf/tomcat/shared folder).
- Locate the Grafana URL: GRAFANA_HOST=http://54.167.241.116.:3000 and enable the flag:
GRAFANA_DASHBOARD_ENABLED=true.
Activate a Job to Pre-load Every Night (Optional)
If this flag is enabled, the server will activate a job to pre-load every night at 00:30 (local server time) the data of the last 29 days for the Reliability Dashboards:
GRAFANA_CACHE_WARMUP_ENABLED=true
This means that the last day (recent data) is loaded dynamically, while older data (last 29 days) is loaded from cache.
Moving from an External Grafana to the OverOps Bundled Grafana
- If you have a separate Grafana instance you've installed and activated on the backend machine, you should remove this instance - once you do this, the bundled Grafana instance will be able to run.
- Next, go to the OverOps On-Premises "my.server.properties" configuration file (under the /opt/takipi-server/conf/tomcat/shared folder).
- Locate the setting GRAFANA_HOST and remove it.
- Restart the takipi-server.
Updated 9 months ago
