Searching the Dashboard
Introduction
The search bar is a flexible and controllable filtering mechanism that enables you to find and display on the graph any subset of errors you'd like.
Searching the Dashboard
All errors and exceptions on your OverOps dashboard are searchable, which means that you can find exceptions by type (caught or uncaught), error name, label, location in the code, the number of times they occurred, when they were last seen, their error rate, and the notes you added.
To search, click the search box on the right of your screen under your graph.
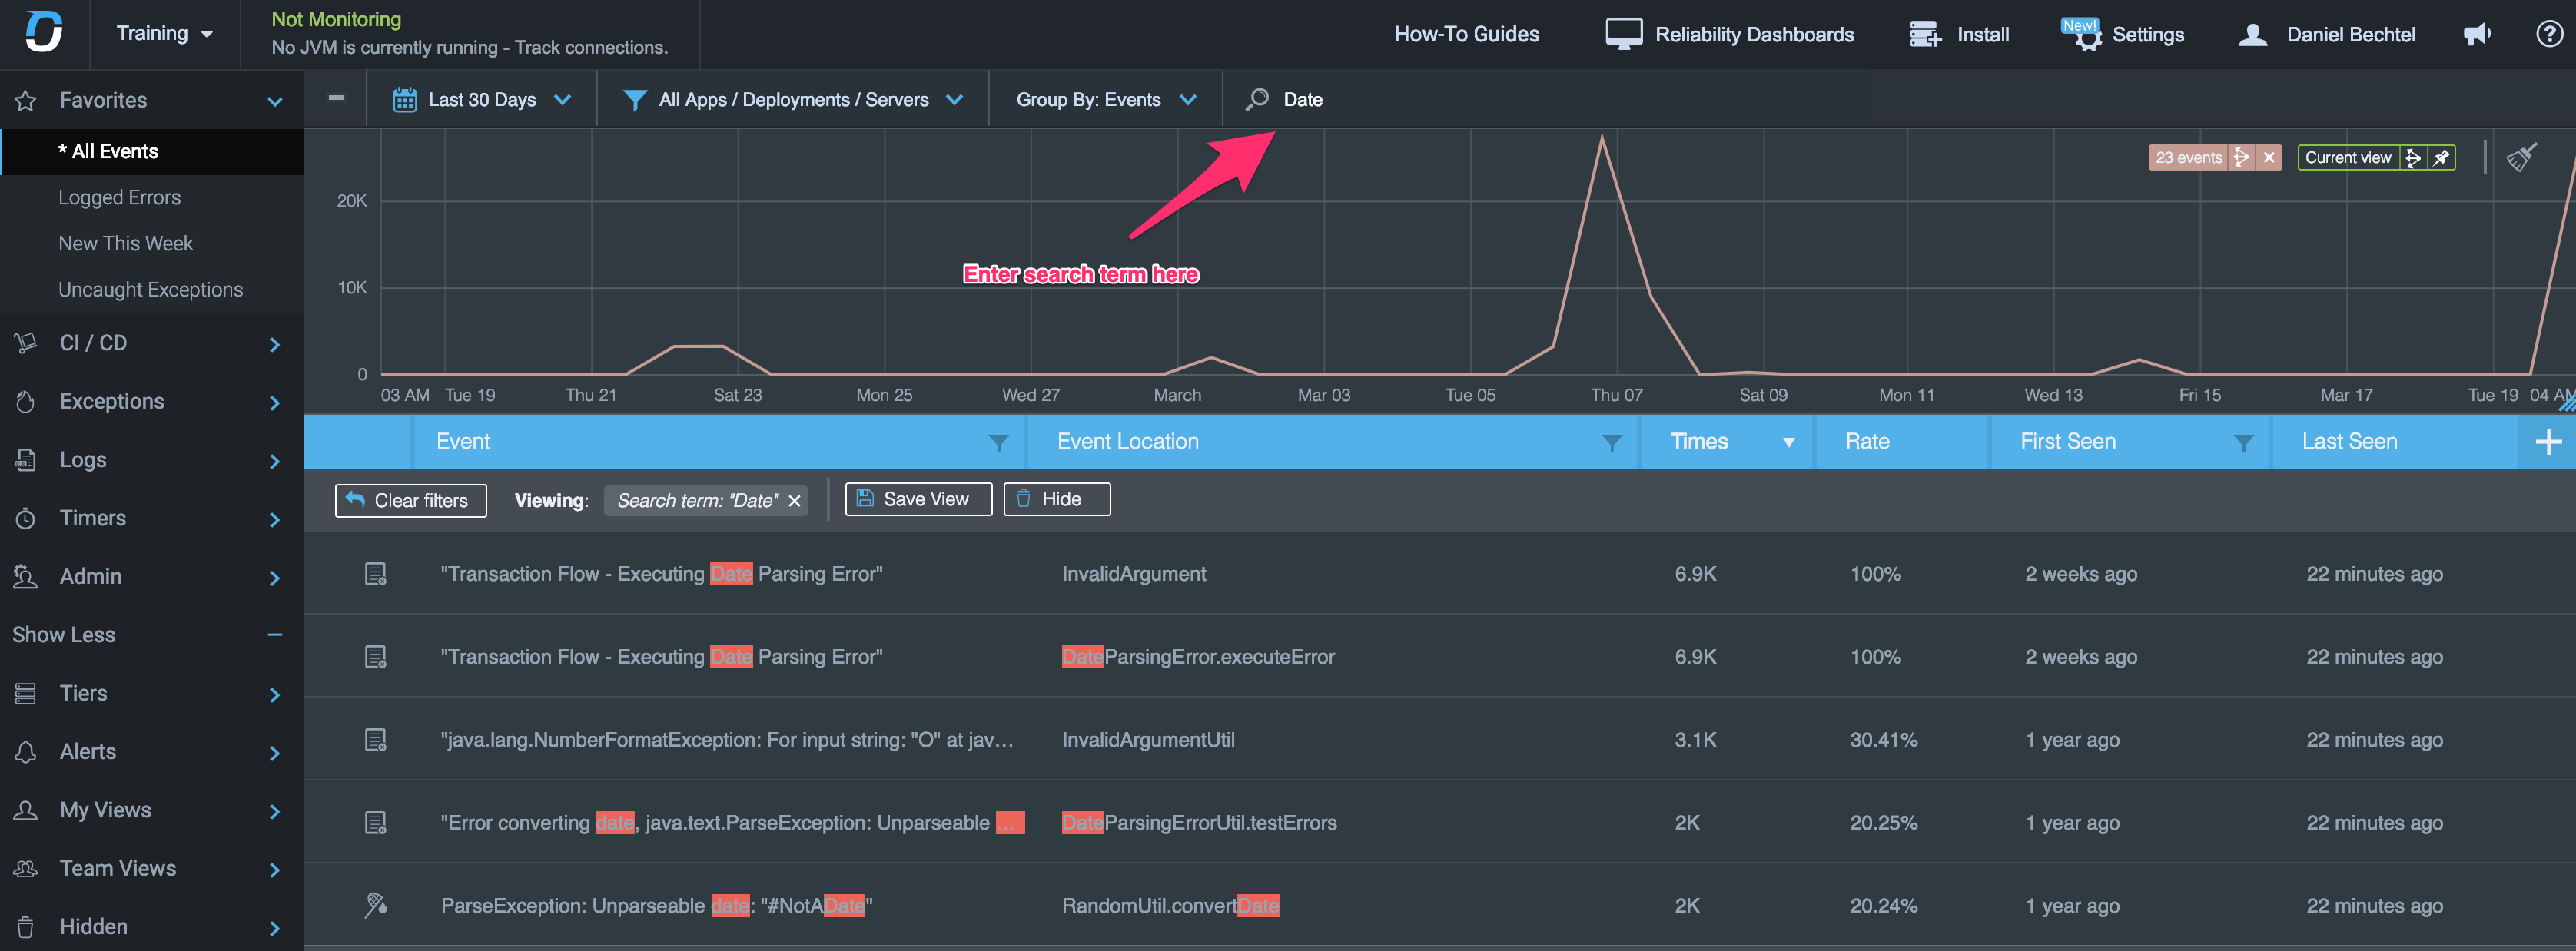
The event list and graph will be updated as you type your search and the text will be highlighted in each dashboard entry. The search bar will autofill suggestions for you as you type, helping to save you time. If one of the autofill suggestions is the one you want, simply click it to run the search
You can also use the search phrase to create a view, the same as using any of the other grid's filters. Click here to learn more about creating views.
Related Articles
Updated about 1 year ago