AppDynamics Integration
Introduction
AppDynamics utilizes a Java agent to measure the performance of calls (i.e., transactions) into the application. Through its integration with AppDynamics, OverOps leverages its continuous code analysis to deliver the complete Root Cause behind any error or slowdown directly within AppDynamics. OverOps analyzes the application code at the environment level to enhance log data when an event occurs. With the OverOps and AppDynamics integration, links are inserted directly into the log files so that deep, code-level context can be surfaced and accessed during the troubleshooting process using a single click.
NoteCurrently supported only on the JVM languages listed here.
Because there's no conflict between the two agents - AppDynamics is a Java agent while OverOps is a native agent - OverOps and AppDynamics can happily co-exist.
How does It Work?
AppDynamics displays a list of identified transactions via the AppDynamics agent manual user config, and the number of failed / slow transactions over time. When set up, the integration enables you to see all your errors from OverOps in the AppDynamics dashboard.
In the service you designate, you'll see every new event from your application. The type of event, name, and environment are all listed, as well as a link to the OverOps ARC screen. The message also shows you the call stack, and the server and environment (if you’ve named them) that the event occurred in. Clicking an error’s name will open up the error analysis screen in OverOps, allowing you to view the exact variable values at the moment of event, and further investigate it.
Integrating AppDynamics with OverOps
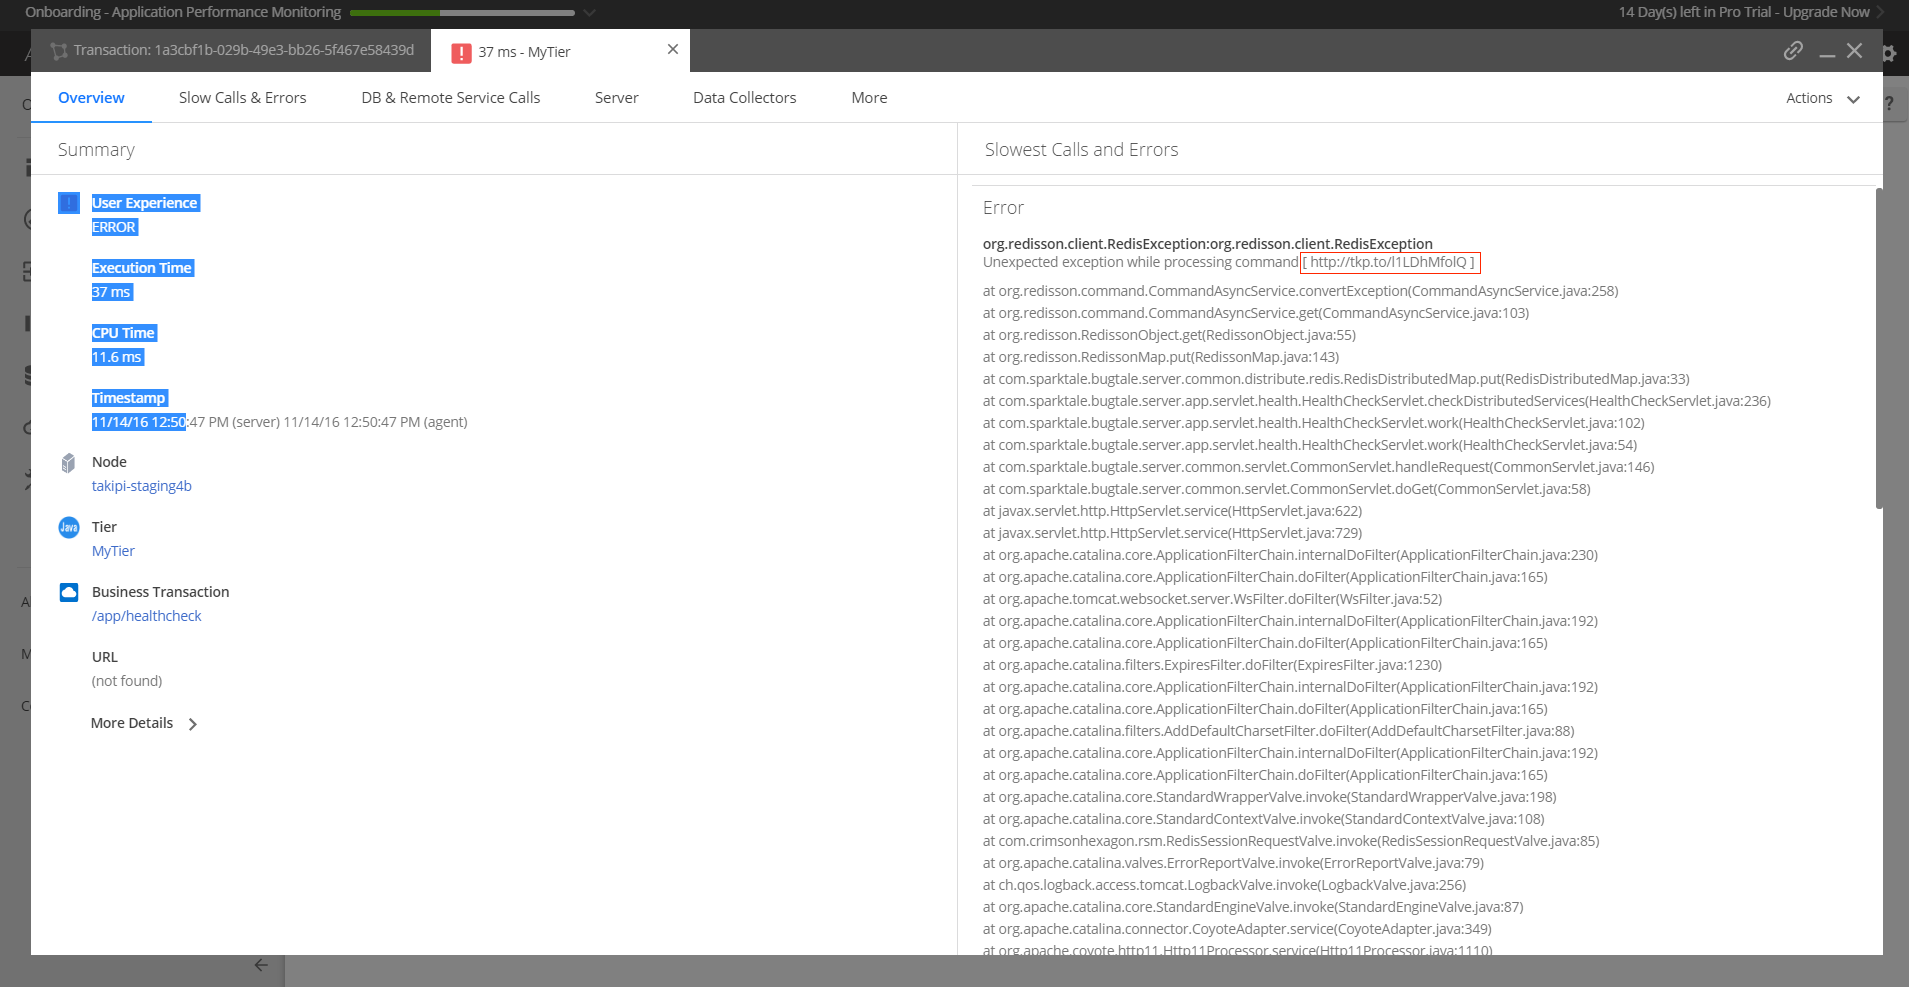
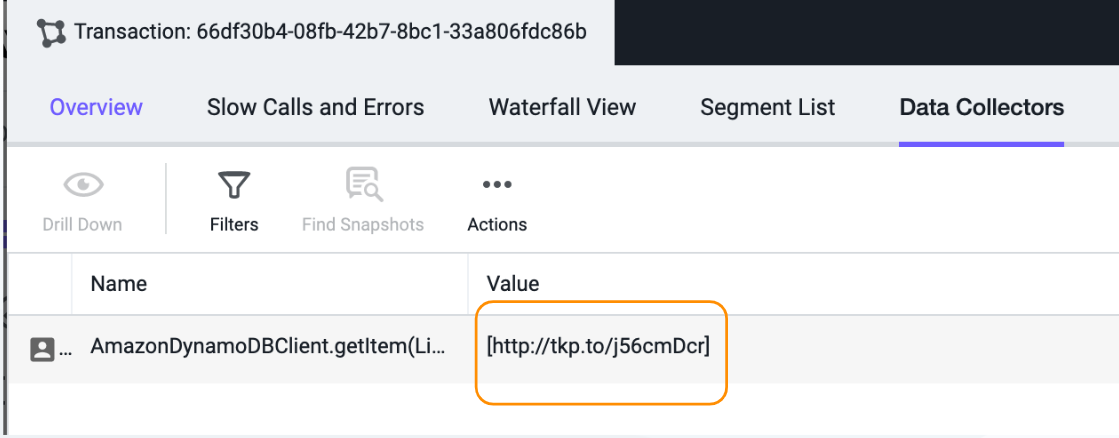
With AppDynamics, the OverOps short URL can be seen either in the Log Analytics screens or in the Business Transaction Snapshot view.


Clicking the short URL takes you in context through to OverOps, where you can see the source code, variables and their values, letting you fix the problem immediately without having to reproduce the error in an another environment.
Setting up the Integration
- In the AppDynamics main menu, click Configuration, and then Services.
- In the Services page, in the upper-right corner, click Add New Service.
- Under Integration Type, choose Generic API, name your service and then click Add Service.
NoteAppDynamic Events are part of the Hidden tab in your dashboard since they generate a lot of potential alerts. You can decide to add alerts anyway using the explanation below.
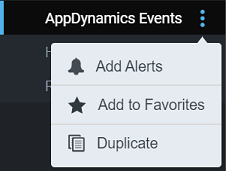
- Go to OverOps and in the OverOps Views, go to AppDynamic Events under the Hidden tab, click and select Add Alerts.

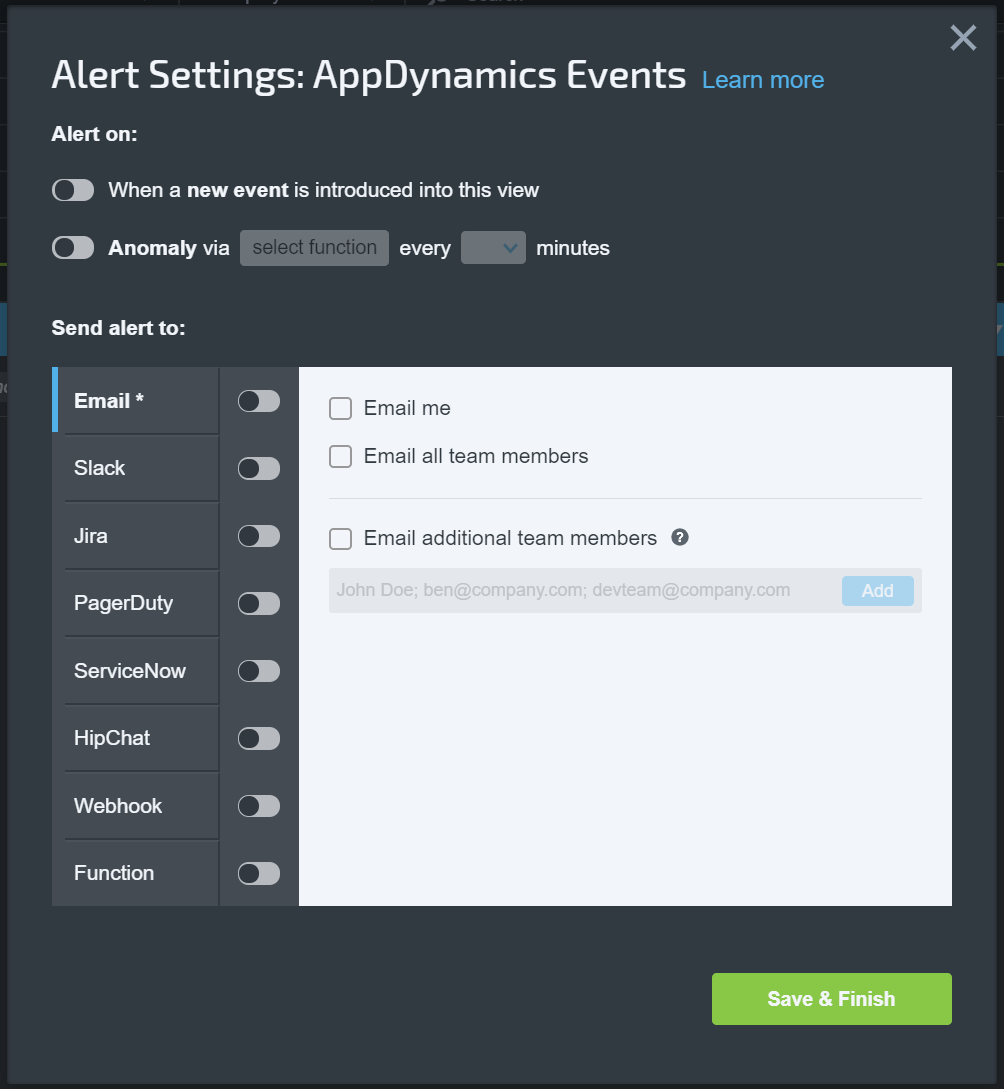
- This opens the Alert Settings: AppDynamics Events window.

- Specify the details for the AppDynamic alert and click Save & Finish.
AppDynamics in the OverOps Dashboard
- AppDynamics slowdown snapshots are enriched with OverOps ARC data.
- Event snapshots triggered by AppDynamics are sent to a dedicated View (under the Hidden category) and do not trigger additional alerts in OverOps.
Related Articles
Updated 12 months ago
