Opening the ARC Analysis Screen
The Automated Root Cause (ARC) screen displays the source code, stack, variable state and log statements leading to an error or exception in staging or production.
The ARC screen can be opened from the following tools:
Log Files
The OverOps Agent captures the source code and variable state at the instant an event is logged. The snapshot capturing the event is assigned a unique log link. An example of an event log with the embedded log link is displayed below:
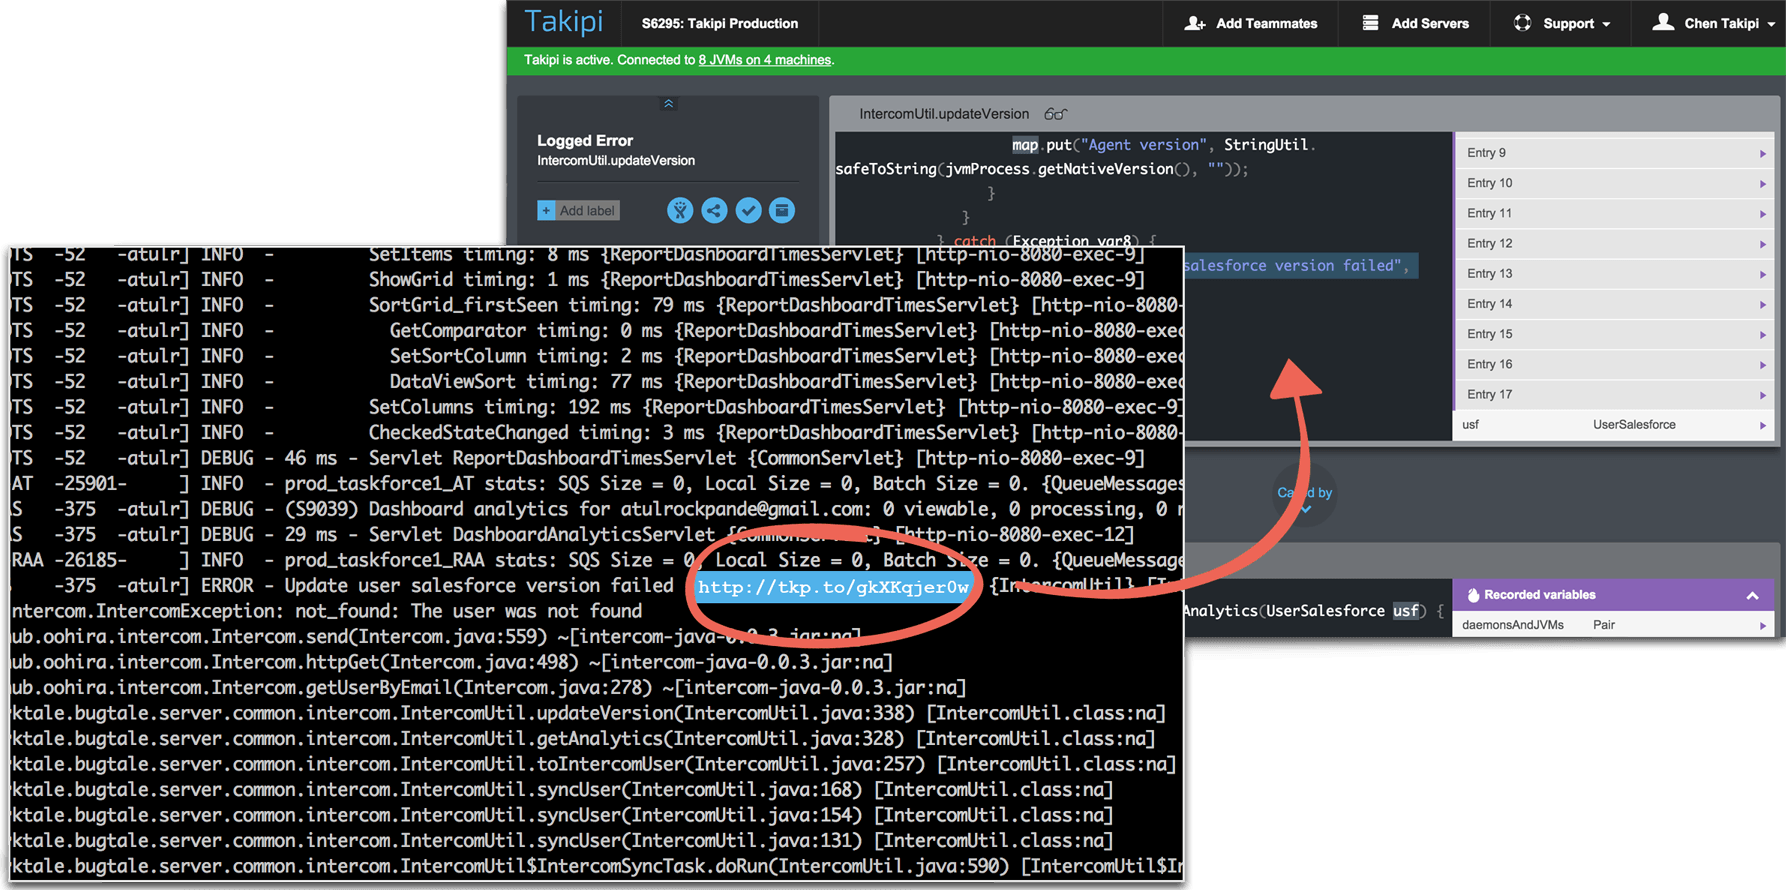
Log links connecting events in your logs directly to their root cause
Event List
The Event List displays all events in the current View and timeframe. Columns in the list - Location, Type, First seen, Last Seen - provide analytics that can be used to prioritize errors. Click an event in the list to open its Automated Root Cause.

Event List
Event Graph
Click any point in the Event Graph, or in an Automated Root Cause currently open to jump directly to the closest snapshot. Combined with Application/Server filtering, this provides an efficient tool to determine the cause behind and surge or spike of errors within the environment.

Click any point in the graph to jump to the closest snapshot
Splunk, ELK, and Sumo Logic
Since log links are injected at the environment level, they become an integral fabric of the log structure. This means that you can jump directly to the root cause of any error, from user interfaces such as Splunk, Sumo Logic, Loggly and more, regardless of the Log analytics solution you are using.
Note that Splunk and Sumo Logic are supported only on the JVM languages listed here.
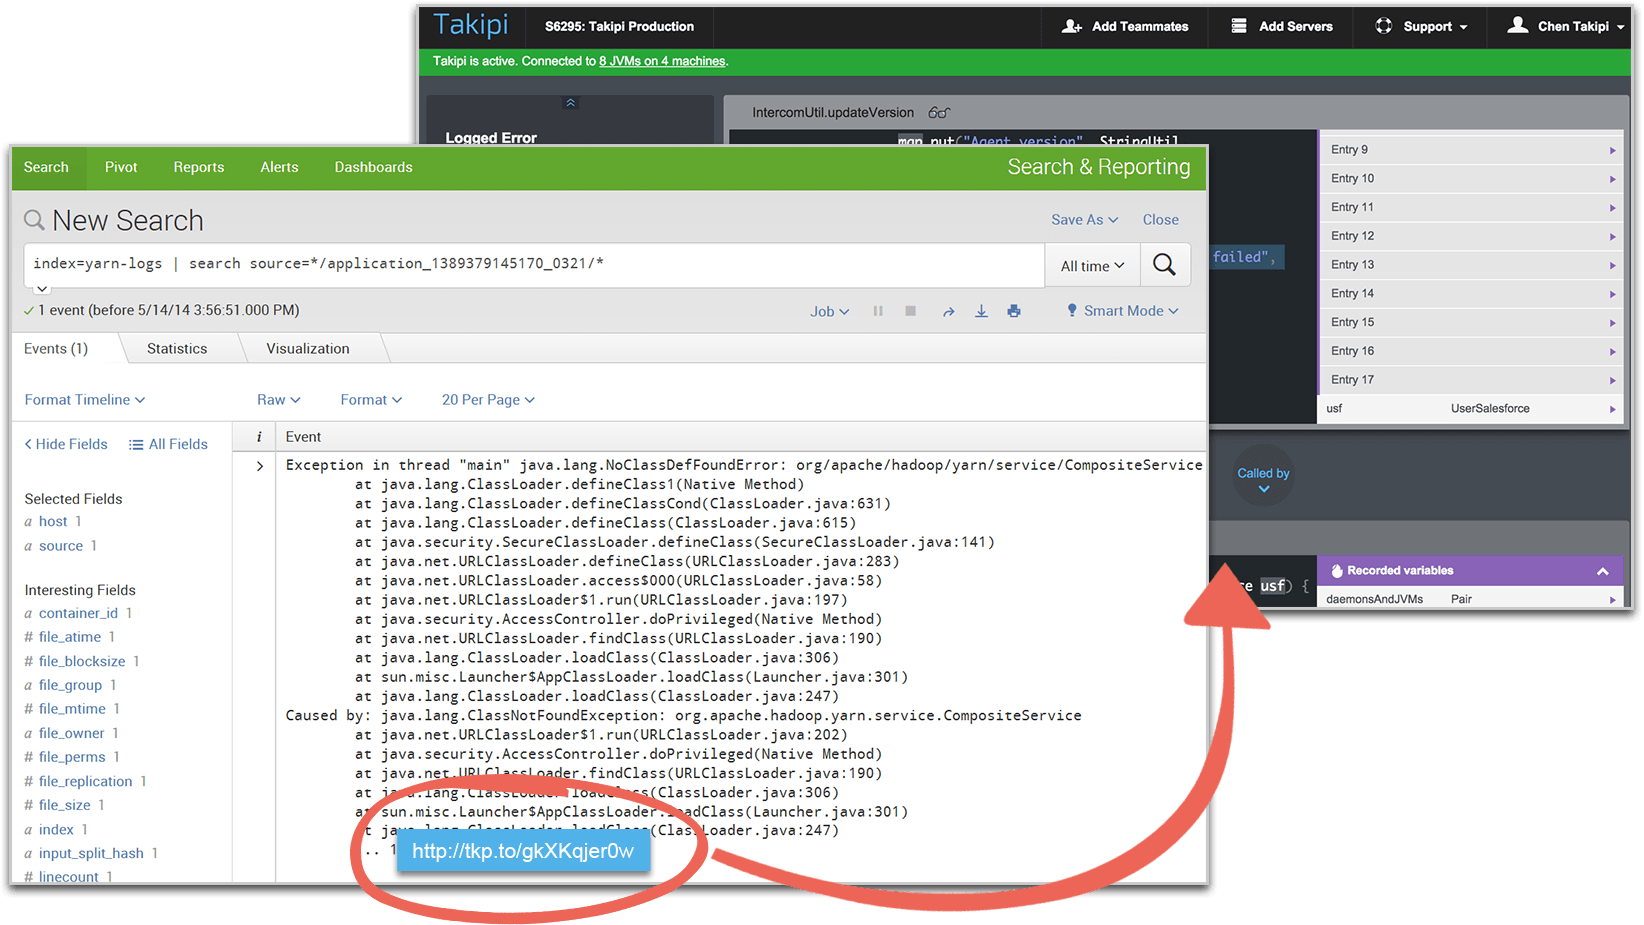
Event Log link in Splunk
Slack and PagerDuty
The OverOps alerting mechanism notifies you of new events introduced to your application in real-time, through Slack or PagerDuty. The alert contains information such as the application name, server, stack trace and more. Click the alert to open the event Automated Root Cause.
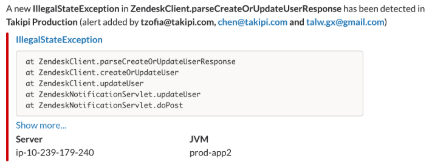
Alerts in Slack, HipChat and PagerDuty take you directly to the event root cause.
Email
The Alerts dialog box also enables setting up email alerts to be sent when new errors are introduced, and as a digest of events to prevent overload.
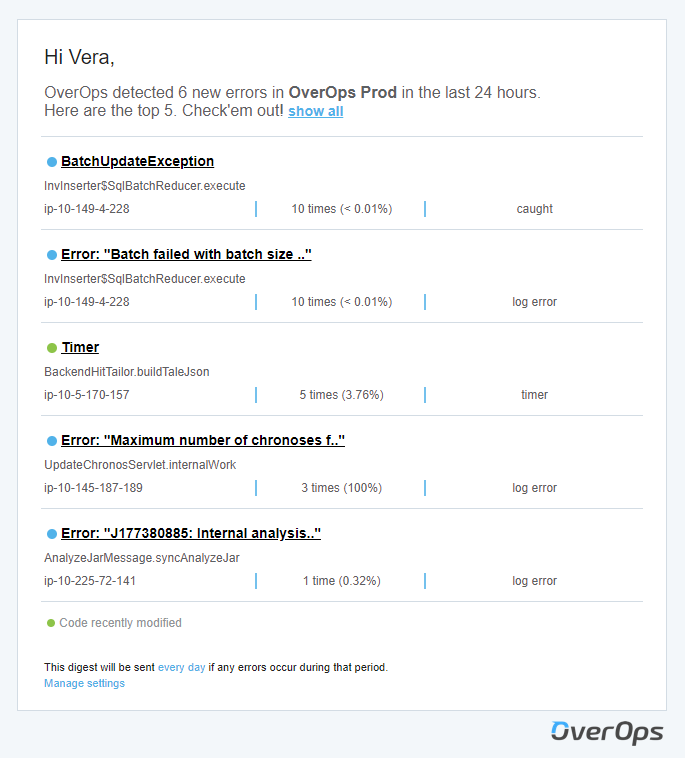
Email Digest
Jira
OverOps enables you to open a Jira ticket for any event directly from the Dashboard or the Automated Root Cause. This provides a way for teams to collaborate around errors and and issues in your environment and share critical information between developers, operations and QA.
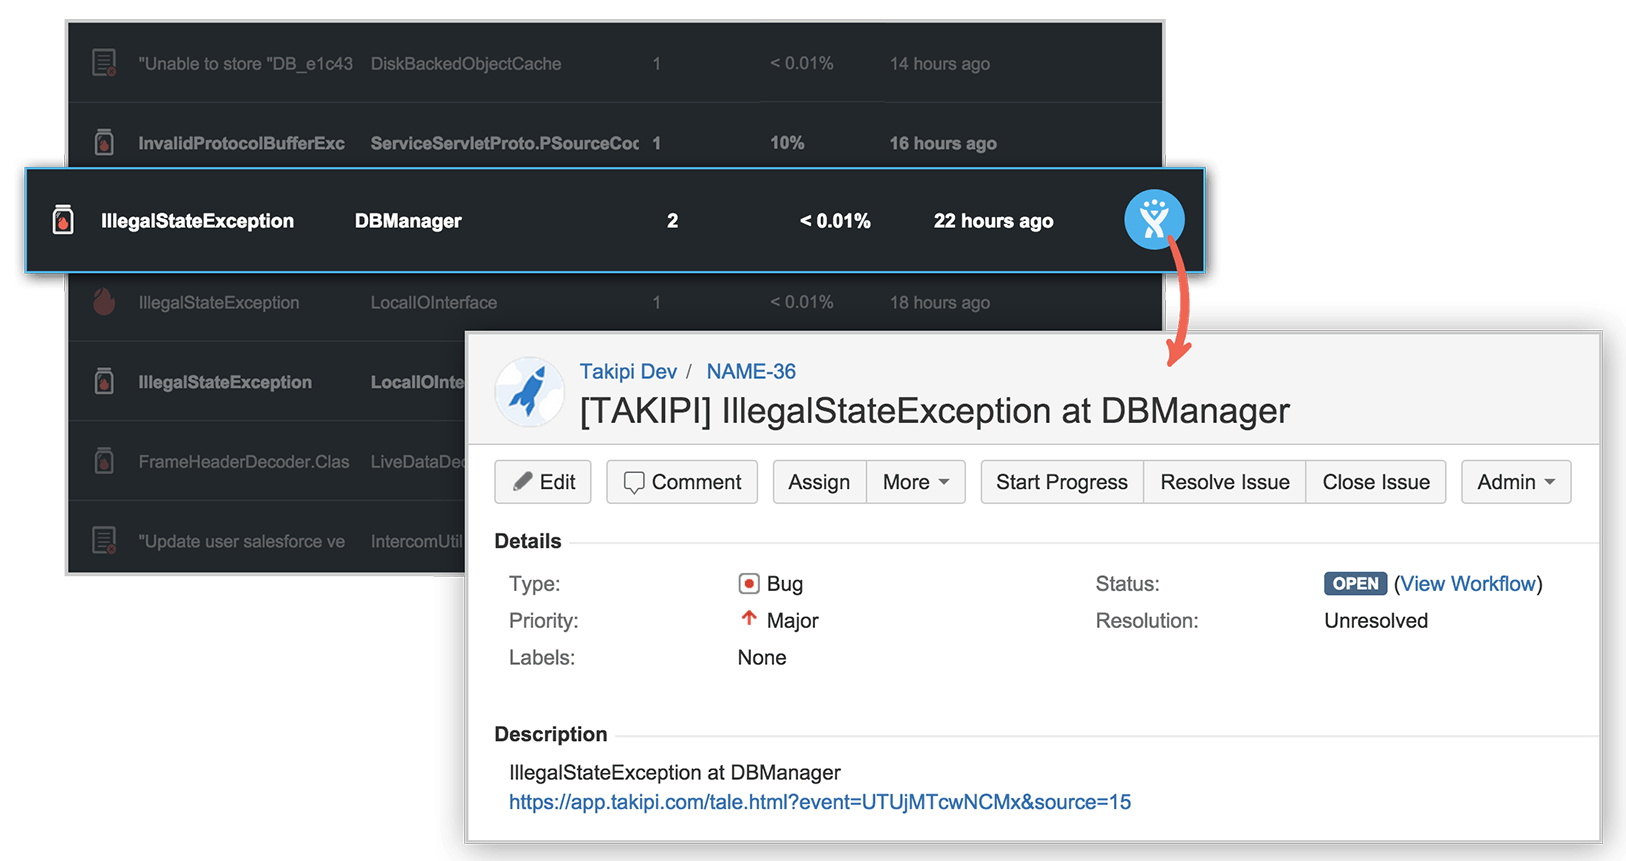
Jira issue linking to the event
Sharing Events with Team Members
Any root cause can be easily shared with team members by adding a note to it and tagging the team member to be notified.
To add a note:
- Click Edit Note in the Automated Root Cause toolbar,
or
Right-click the event Dashboard Event list and then click Edit Note. - Write a note and, in Tag People, insert the relevant email addresses to invite to read the note.
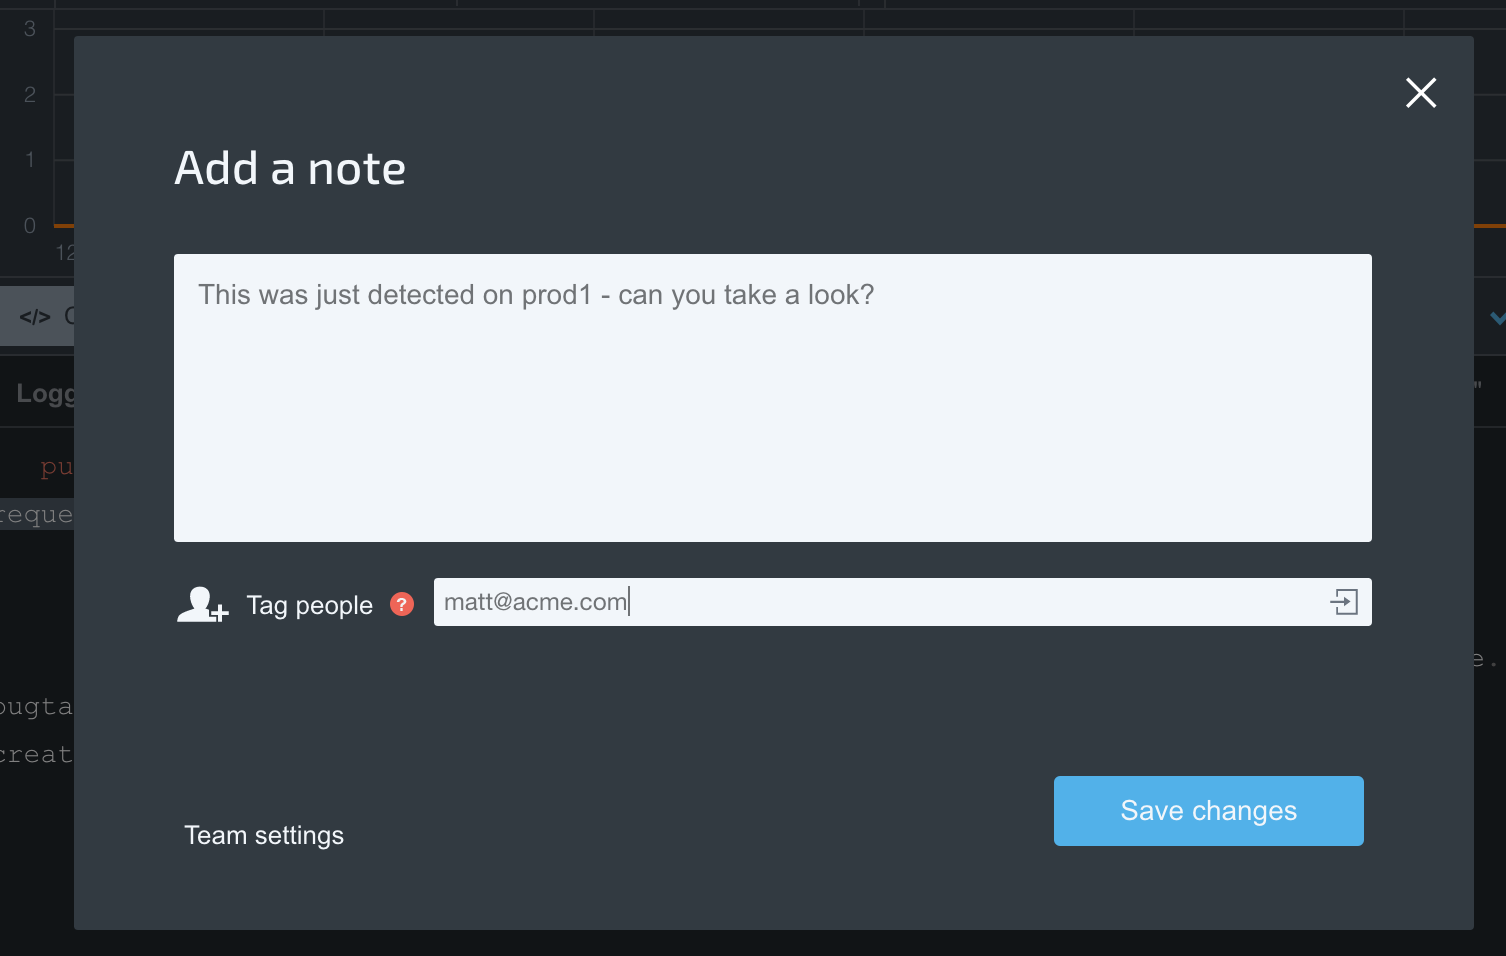
An email is sent to the added emails with the note linking to the event.
Updated 12 months ago
