Log View
Introduction
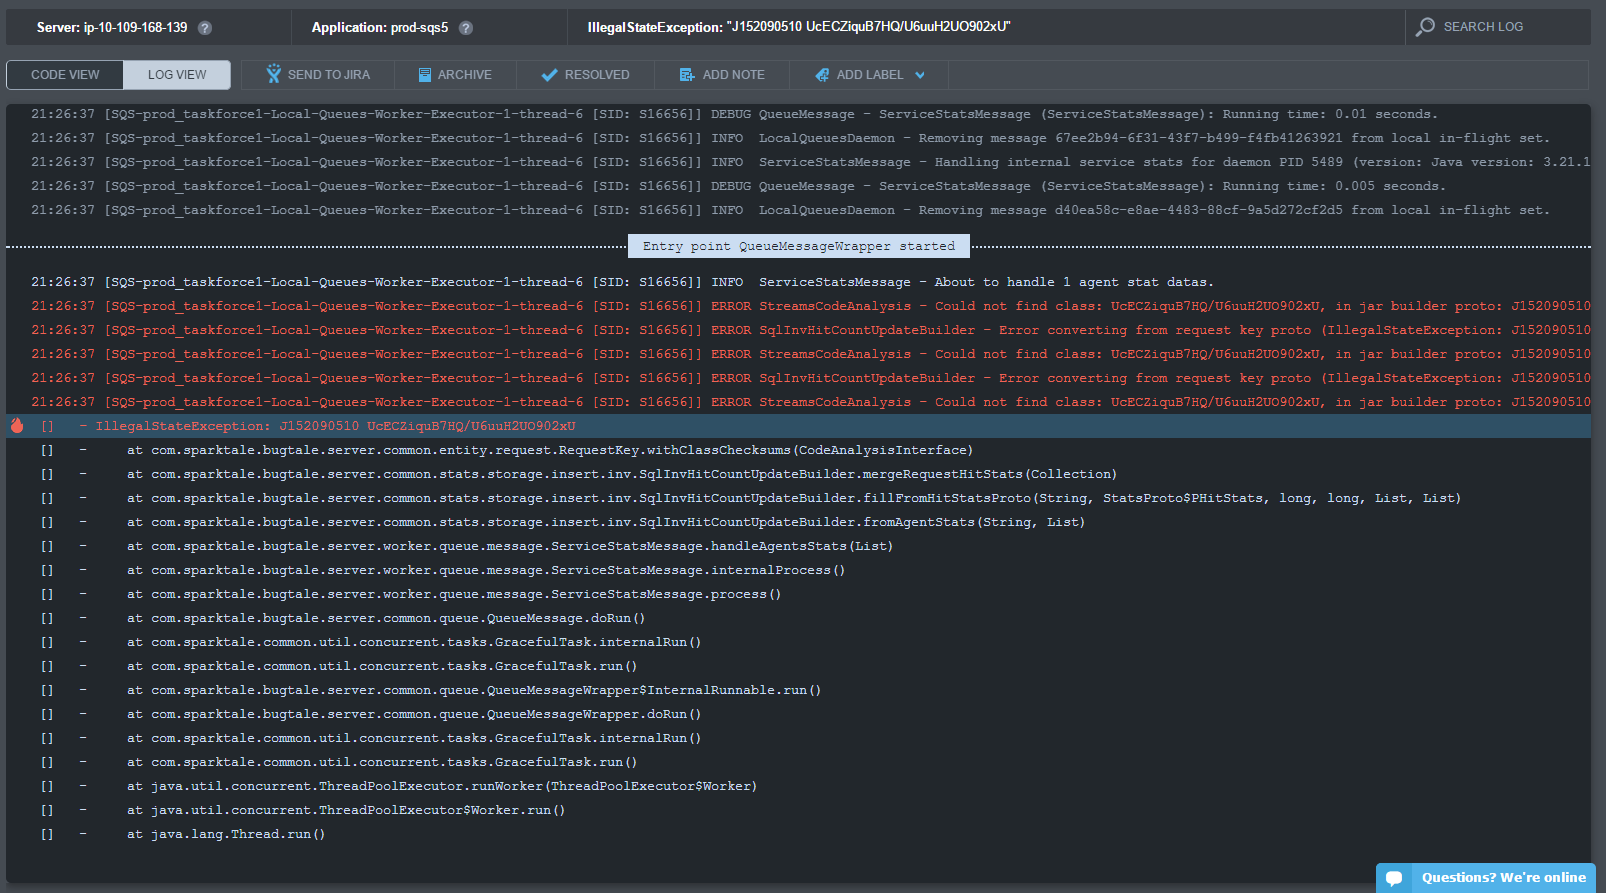
Within the ARC screen, users can get all the information required in order to understand and fix an error, including the state, stack, and source code that led to it. To complement this, OverOps also displays a Log View for each error and exception, which shows the last 250 log statements leading up to the error, giving an easy way to work with the OverOps code (“classic”) and log data - without leaving the application.
Availability and Support
This feature is available to OverOps users from version 3.22.0, and supports the following logging frameworks: logback and log4j.
Opening the Log View
To open the Log View:
- From the ARC screen, click Log on the event header:

From this tab, you can also switch to Code View or JVM View.
OR
- Create a Log View URL: add “#log” at the end of the event URL.
Log View Basics
By default, the Log View contains the 250 log lines that preceded the event.

Log View
The Log View enables you to sift through the log entries (“info”), log warnings and error entries. Since OverOps creates the Log View directly from the JVM, additional information, such as “DEBUG” and “TRACE” entries, is not always available in the logs themselves. Different log events are highlighted for convenience, and navigation between them is available using keyboard shortcuts (arrows, page up/down/home/end).
In the Log View, the error or exception lines are displayed first, followed by the Stack Trace. OverOps also displays the context of the event, by highlighting the beginning of the relevant transaction in which the event happened.
Note : All the advanced features and functionalities in the ARC screen are also available in Log View - handling the event (archiving, resolving, labeling), sharing it (via Jira or OverOps' notes) and searching within it.
In addition, as OverOps injects log links into your log files, the OverOps URLs are displayed within the Log View, allowing you to open new errors and exceptions in a new tab directly from the Log View, as you do from the log file itself.
Log Level
- Logback: TRACE level and up
- Log4j/Log4j2: According to the user's config
Log4j2 allows for custom log levels and names, however, OverOps reports on levels <= 300.
Missing Log Statements
Message | Reason |
|---|---|
This snapshot was taken before log views were introduced. Please try viewing a more recent snapshot. | The snapshot is out-of-date |
Log views were introduced in version 3.22.0. | The OverOps Agent or Collector needs to be upgraded |
No log messages have been recorded for this snapshot. | No Log messages detected |
Log view is not available due to Storage Server error at the time of this snapshot. Please check storage server connectivity and status | Storage Server error |
No supported Logging framework was detected. | No supported log provider was detected |
| Trial OverOps version |
Ooops, something went wrong… | Cerebro exception or Unknown error |
No log messages were detected for current entry point. | Context / transaction data is missing |
Advanced
To change the number of characters recorded per log statement:
- Add the following argument to your JVM startup arguments (default is 10K):
-Dtakipi.cerebro.message.max.length=1000Related Articles
Opening the ARC Analysis Screen
The Information and Actions Menu
Updated 12 months ago
