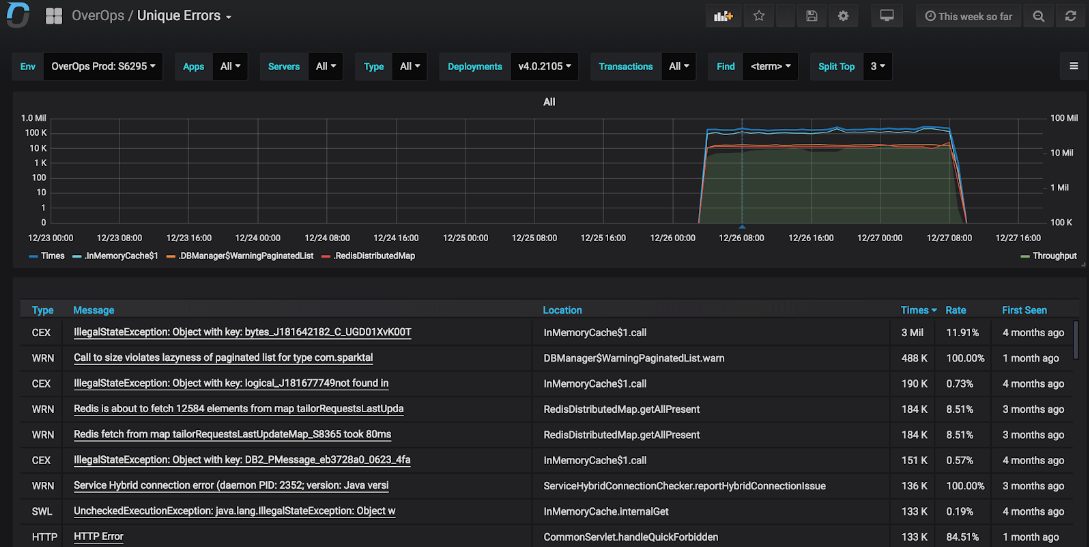
Unique Errors
The Unique Errors dashboard presents a user with a deduplicated list of all events taking place within the target environment(s) and filter set. This capability is similar to that provided by the https://app.overops.com console (the OverOps Dashboard).

If the value of the group_by_entryPoint field in the Settings Dashboard is set to true, all event who the same code location but with different entry points (i.e. the first application code frame within the event call stack) will be grouped into one row within the events table.
Clicking each transaction name in the table will jump to the OverOps Automated Root Cause (ARC) analysis for this transaction that will show exactly the complete state of the transaction at the moment where it exceeded the threshold. This enables developers and SREs to see the actual state within the application that caused that delay to understand whether the cause of the slowdown is code or infrastructure related.
Additional Information
- Clicking one of the top indicators takes you to the Errors-drill down Dashboard, which provides a zoom into an event type.
- The dashboard shows the baseline vs active in accordance with the slowdown and increasing errors dashboards, for better correlation.
- The indicators (top boxes) enable easy filtering according to important event types: uncaught, critical, HTTP Error, and log error.
- All errors are ranked in the dashboard.
Unique Errors Dashboard JSON ModelCustomize the dashboard, or integrate any of the widgets in it by using the JSON Model of this dashboard.
Updated 12 months ago
