Getting started with OverOps
Introduction
The problem
It’s difficult, and sometimes impossible, to identify, prevent, and resolve unknown critical software defects. Oftentimes, there is not enough context to reproduce critical software defects that occur, whether in pre-prod or especially in production. Approaches using APMs and Logs to find the root cause of critical exceptions in Java and .NET applications get complicated by macro trends that introduce more risk:.
- Containers and their many related services.
- Ongoing code changes and dependencies that are distributed. Code becomes more complex, as monolithics are broken down to microservices.
- The increasing velocity of releases. Software quality is increasingly stressed; customers get impacted.
- Zero-trust environments are increasing: increasingly, sensitive applications in production, for example particularly in the finance sector and other sectors with intense security requirements, there is a shift-left requirement and to never touch production.
The solution: root cause analysis with OverOps
OverOps instantly pinpoints at runtime why critical issues break Java and .NET applications, eliminating the detective-work of searching logs to reproduce critical exceptions.
Unlike logs, static testing, and APM, that require foresight, OverOps analyzes code at runtime. OverOps requires no code changes, integrates into your existing CI/CD tooling, and does so continuously, from pre-prod through production.
OverOps plugs into your existing tools and processes seamlessly and extends the value of existing tools dramatically. You don't even need to add code with OverOps. OverOps simply tells you precisely where the issue originated and why. So you can continue to accelerate innovation, without sacrificing quality.
Installation
This document and instructions are intended for users following our trial installation.
If you already purchased a license please follow our instructions for
Java
.NET
Prerequisites
Please check our prerequisites before starting the install.
Java
.NET
Installation OverOps Collector and Agent
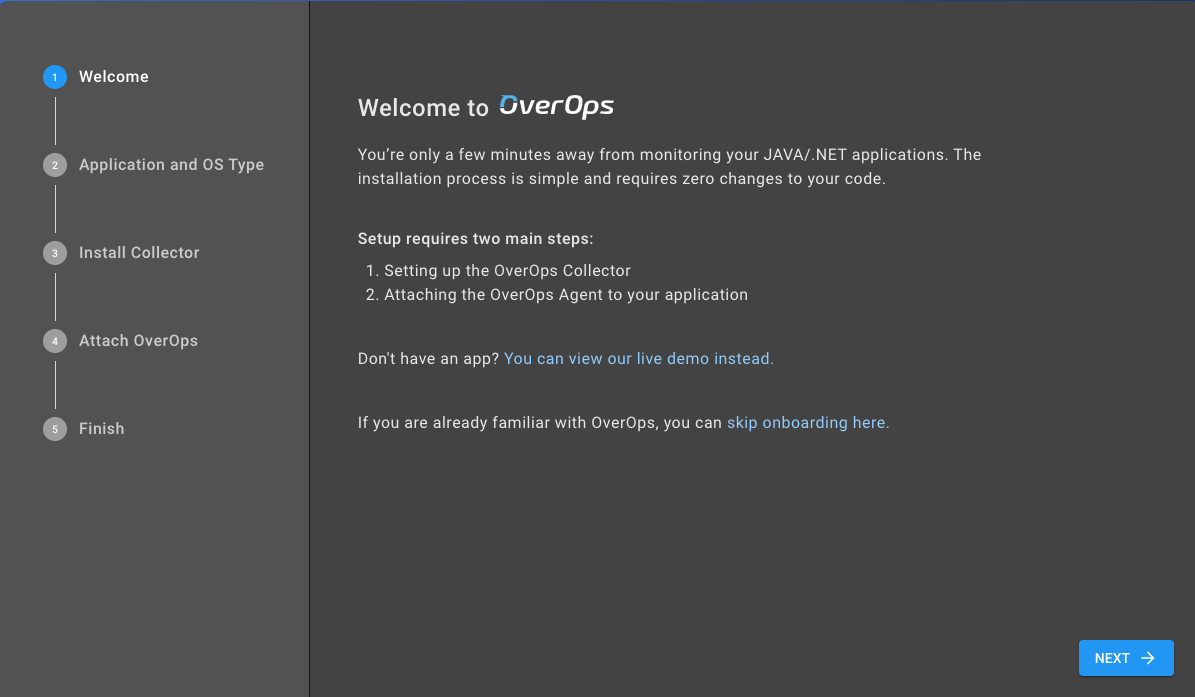
The installation process consists of two main steps.
- Download and install/setup the collector
- Attach the OverOps agent to your application.
For details about these steps please follow one of the videos below that represents your particular installation requirement.
Java application running in
.NET application running in
So what does OverOps exactly do?
OverOps pinpoints the exact cause of critical exceptions with the variable state for context. That way, you don’t have to waste countless hours on detective work sorting through logs to figure out what happened and precisely what needs to be fixed.
Let’s take an example. As a programmer what you typically see is an exception with the related stack trace like the following, not showing you a lot of information as to exactly why and what caused this exception to happen. In some cases you might be lucky enough to have logged the relevant information in your log file, but in most cases it's either not logged or not relevant.
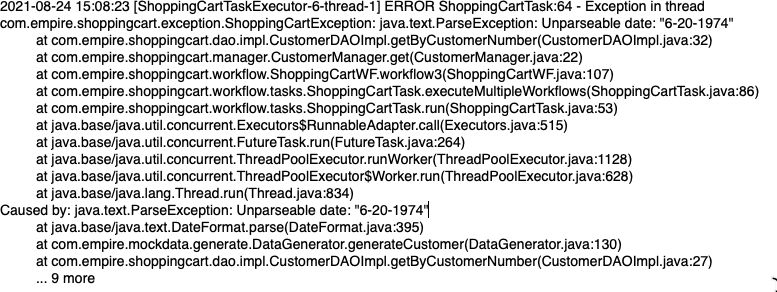
OverOps provides you with all the information you potentially would need to actually solve the problem.
- Without any foresight (no need to add additional logging statements, change code, add debug statements)
- No need to redeploy your application for troubleshooting purposes
- No need to increase your logging or try to figure out how to recreate the problem
- Fits within your existing processes and tooling -- and ultimately actually improves your processes by enforcing quality gating before code promotion
Source Code View with variable and associated state
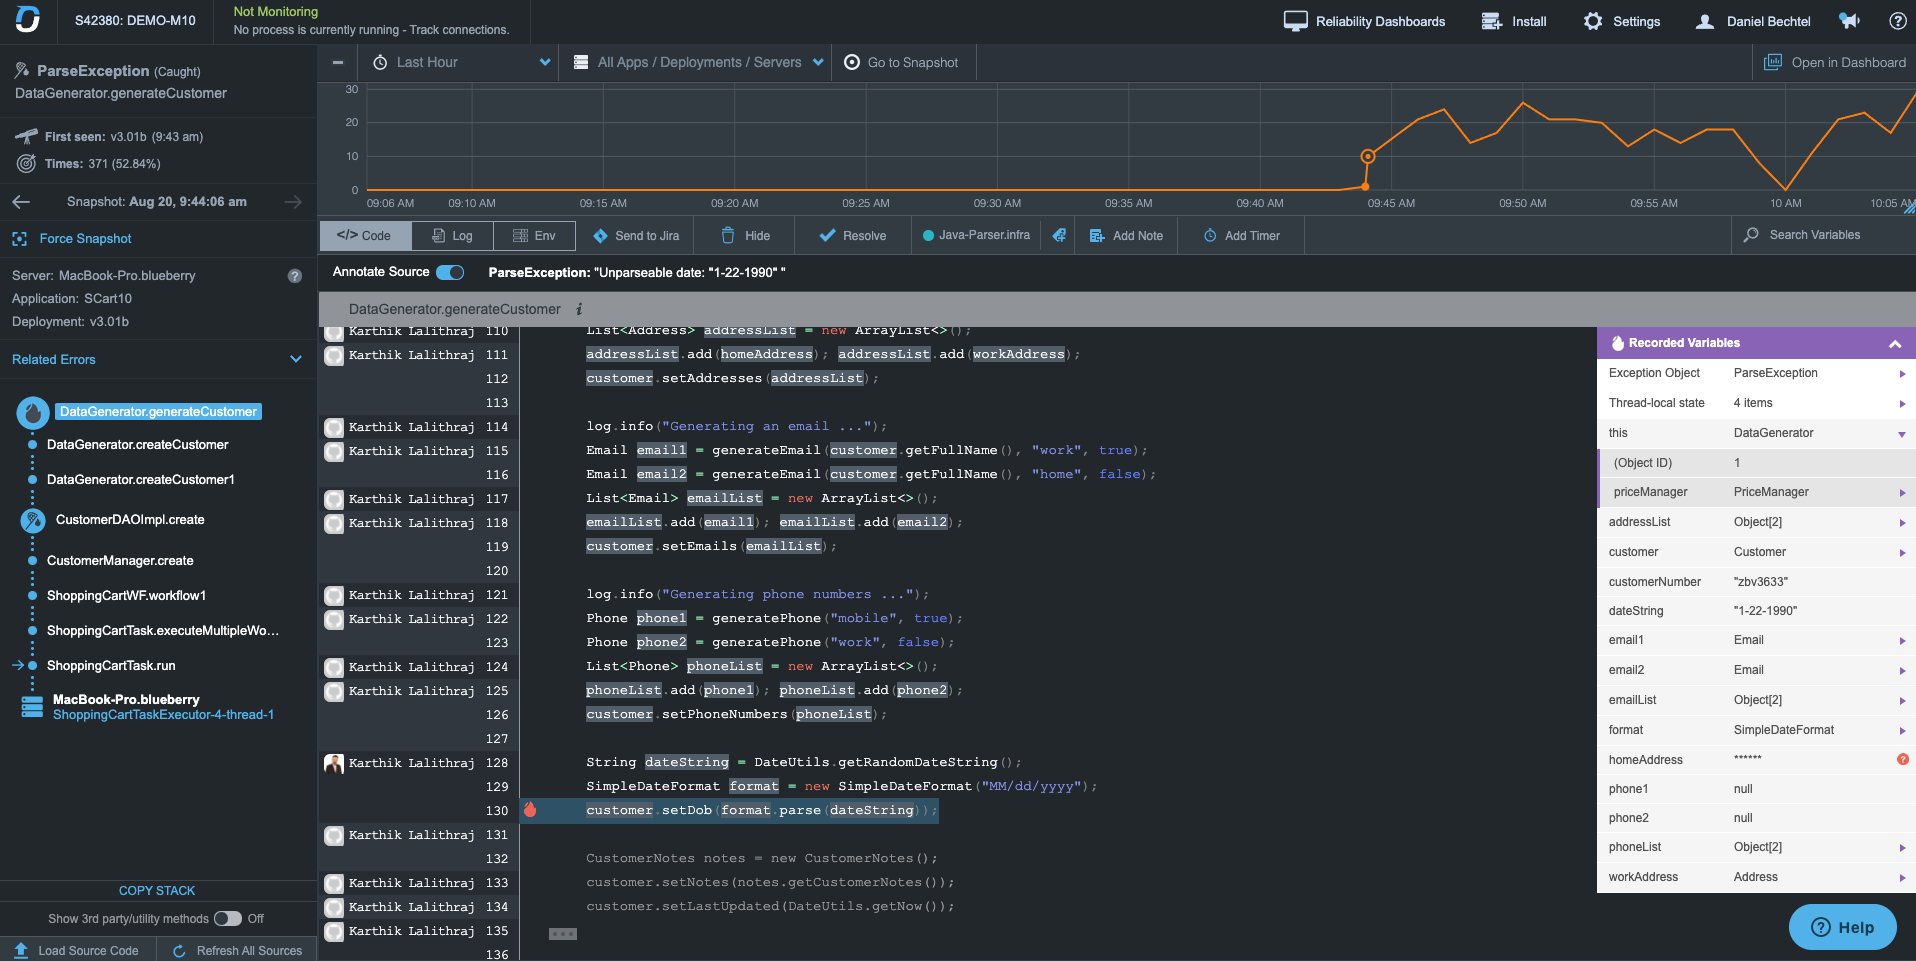
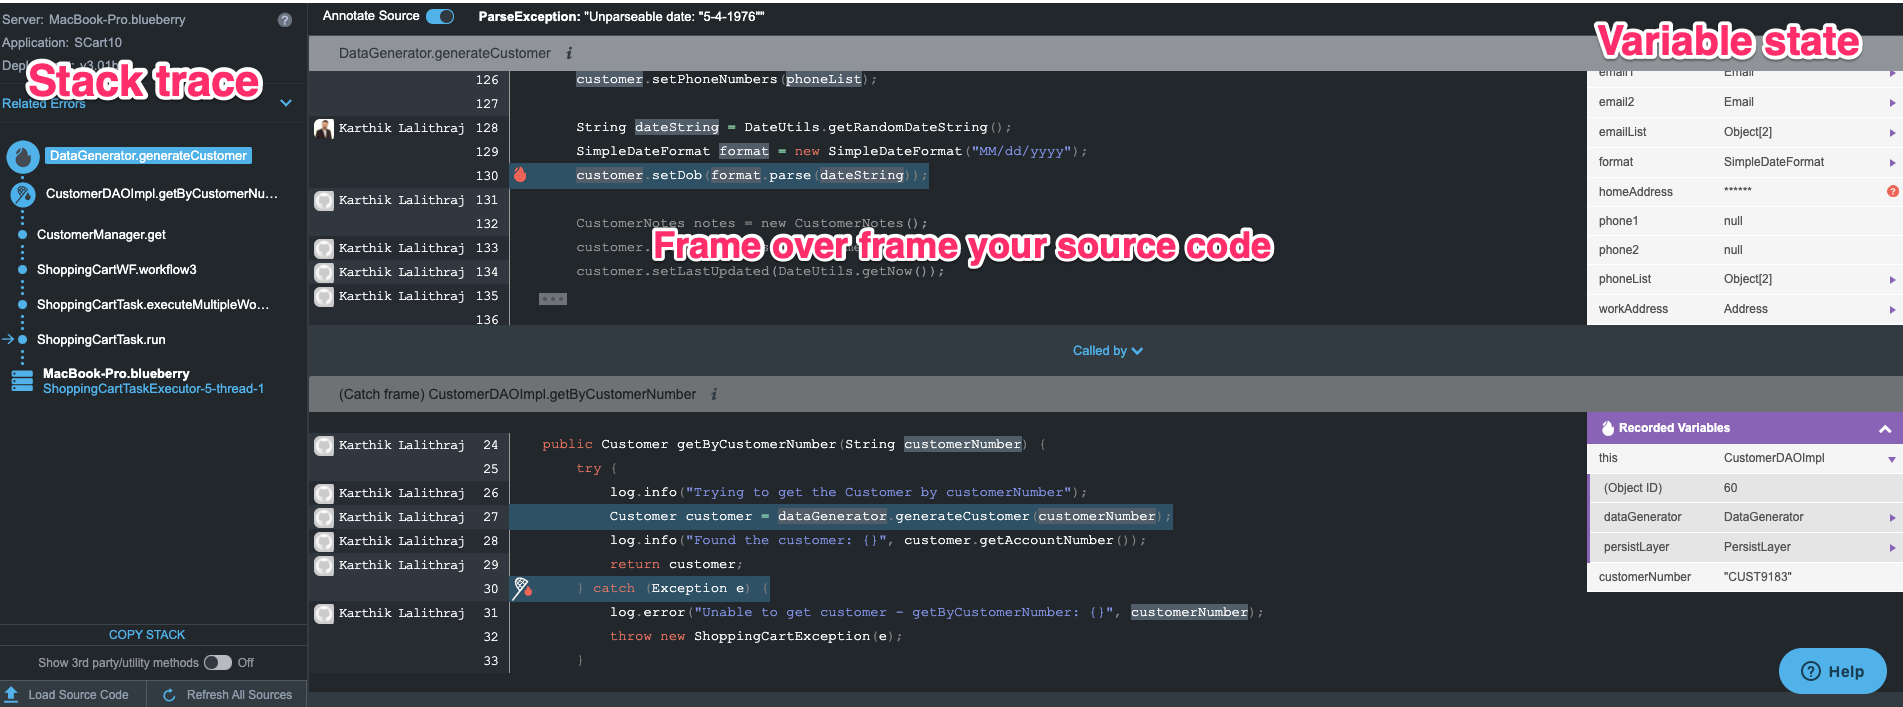
This is what the stacktrace screen equivalent looks like in OverOps. We call it Automated Root Cause Screen or ARC for short.
Left | Middle | Right |
|---|---|---|
The stack trace with indicators of your entry point, where the exception was thrown and where it was caught. | Shows the source code, frame over frame. | The variable state for each of the frames. Sensitive information is redacted. |
In the stack trace example above, the exception/stack trace complained about an unparsable date. Looking at it in OverOps, you can see that the code is checking a different date format than what is shown in your dateString variable.

Source Repository Integration
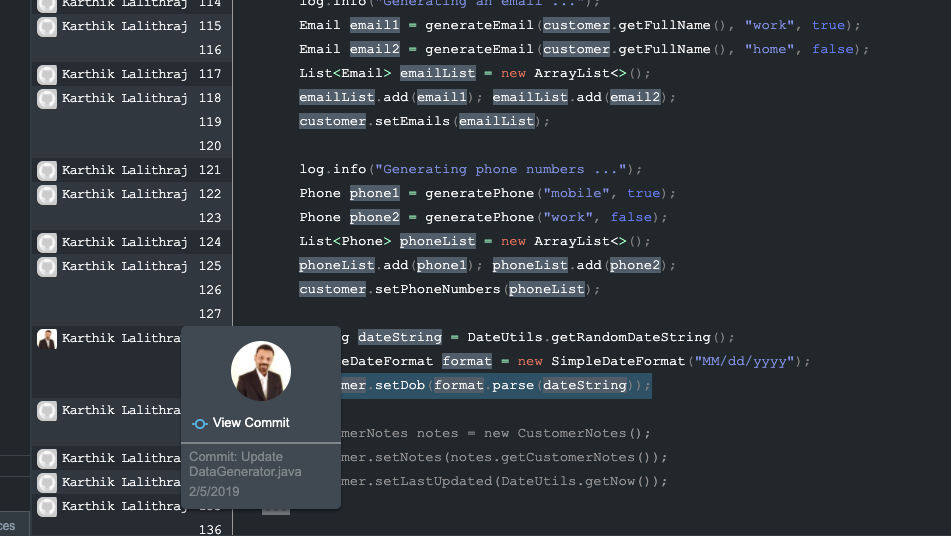
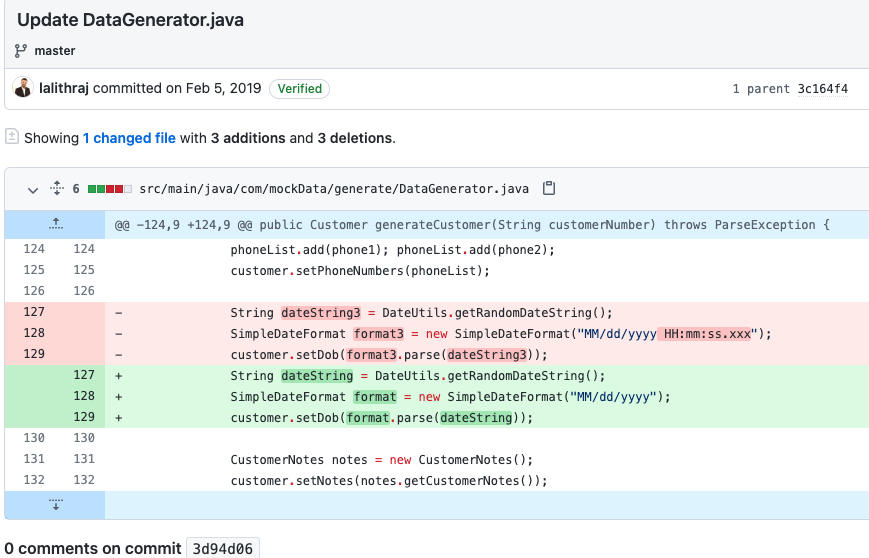
When OverOps is integrated with your repository system (Github, Gitlab, Bitbucket) we can even tell you which commit statement and which lines of code were changed and by whom.
Data Redaction
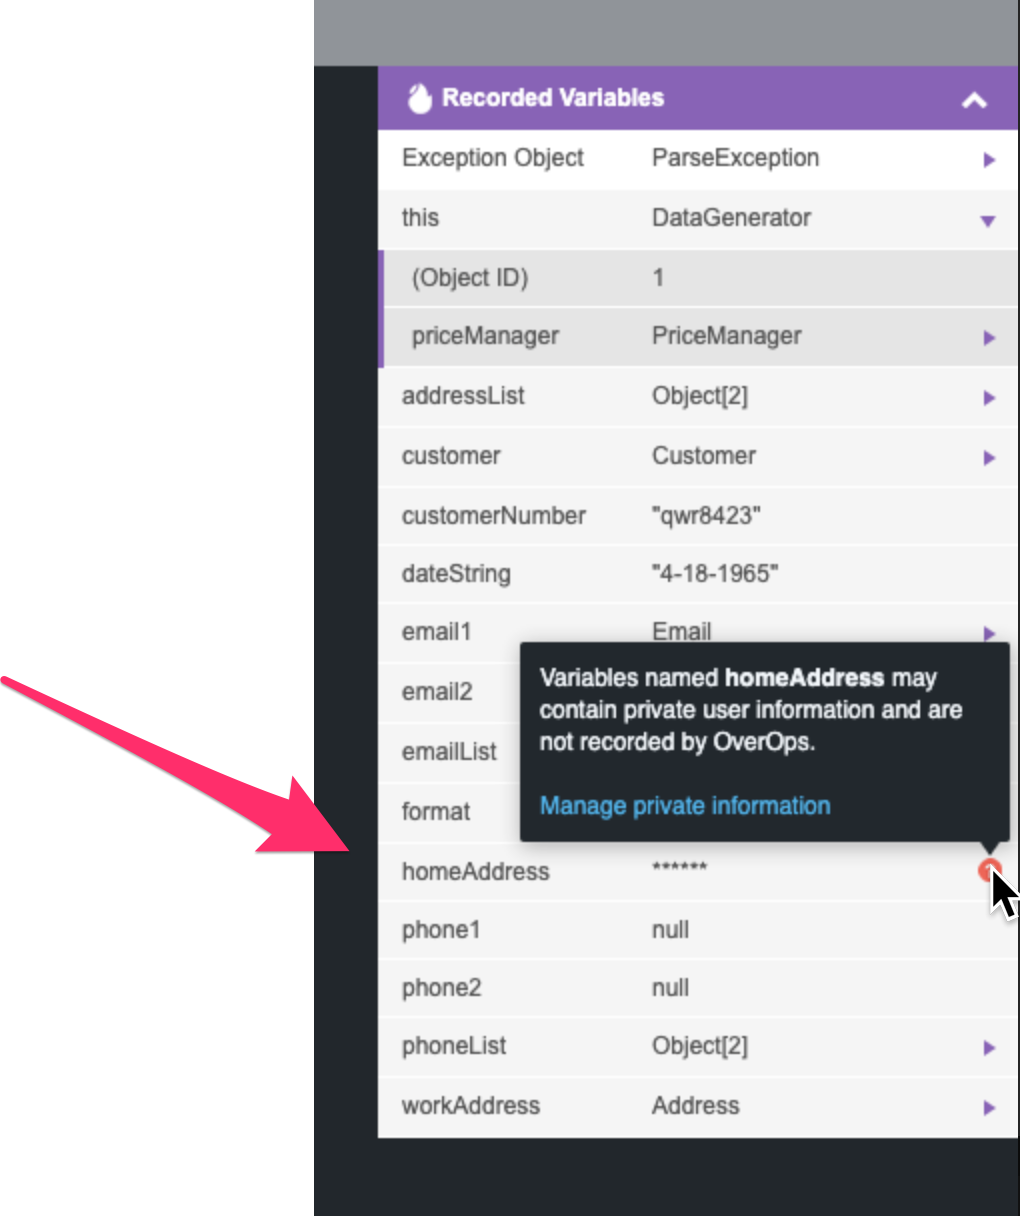
When exposing the variable data, we provide a full set of data redaction features out-of-the-box which can be customized and enhanced to meet your needs. As such, no sensitive information is available or can be shared.
Log View
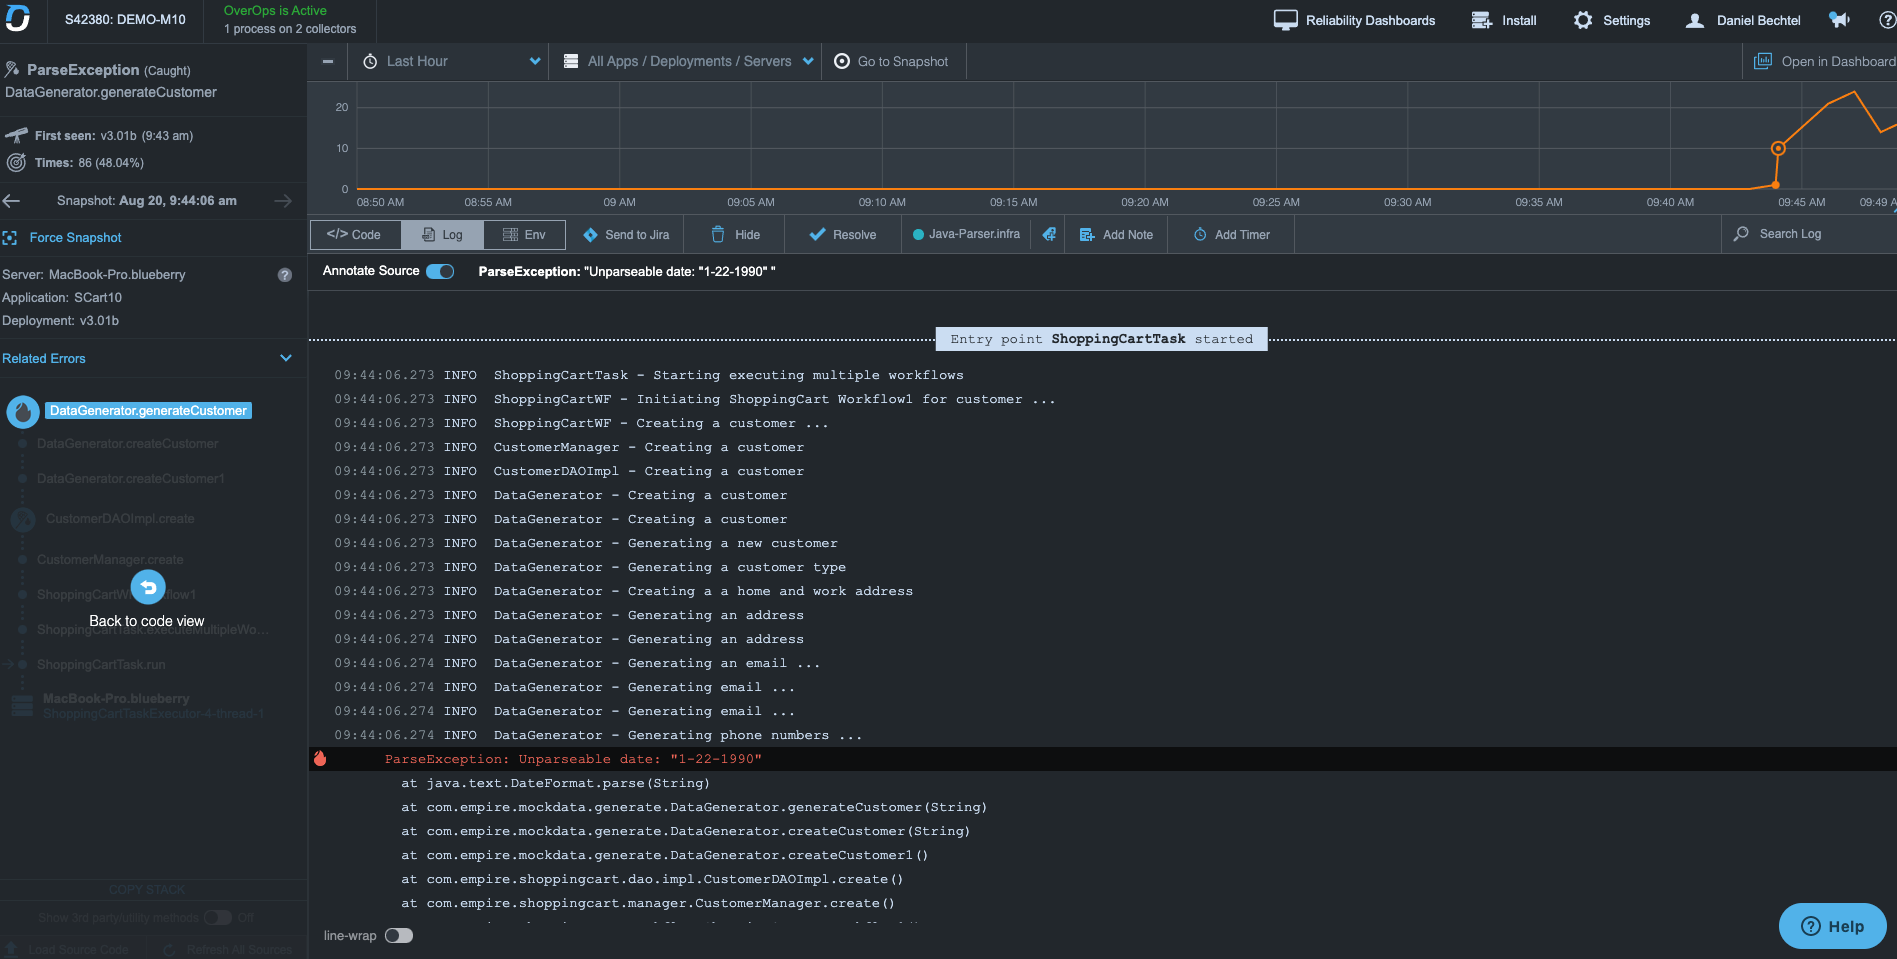
Independent of your logging level settings, we catch all of your logging statements. So even if logging is turned off in your production environment, you will be able to see them in OverOps. This illustrates a superior level of insight into what your application is doing, without having to pay the typical performance tax when logging is turned on.
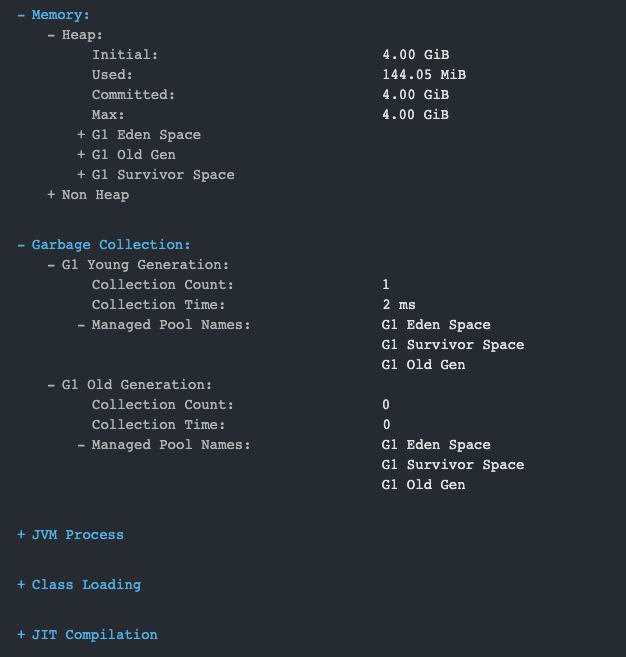
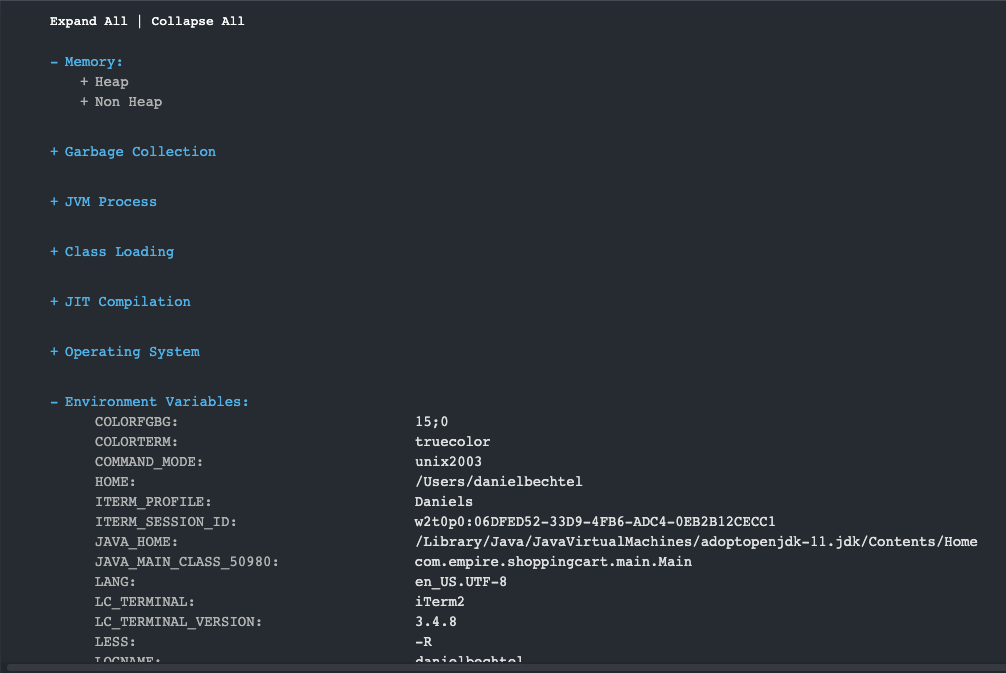
Environment Information
Sometimes the issue is not code-related but environment-related. We provide access to all environment-related information without you having to make any changes in your code or application.
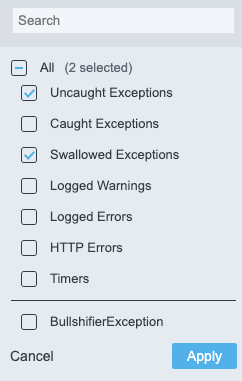
Uncaught and swallowed exceptions
We capture all exceptions including uncaught and swallowed exceptions and classify them accordingly. That allows you to also see exceptions that typically are hidden from you and which may potentially cause issues you are not even aware of.
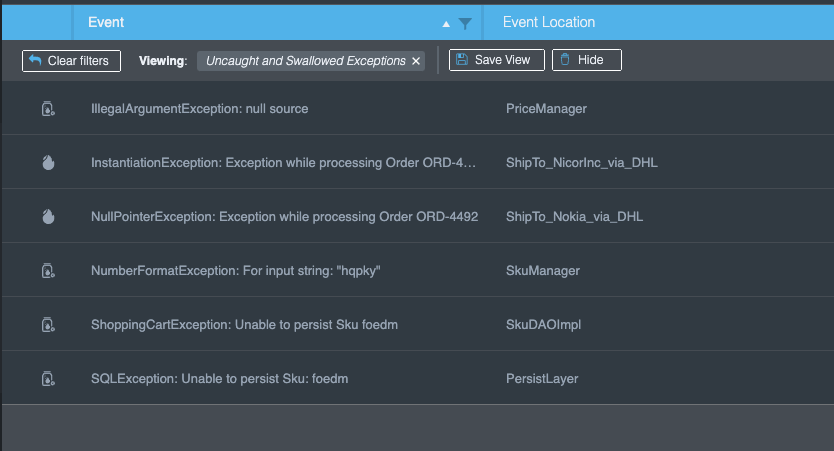
Are you wondering how many NullPointerExceptions, IndexOutOfBoundExceptions or IllegalArgumentExceptions you have and what is causing them? Now you can find out.
Statistical Information
We also capture all relevant statistical information about the events including:
- How many times these issues occur
- The error rate of each event
- When it was first seen and last seen
- Which deployment introduced these events.


You might be surprised how often certain errors might occur in your production system. We have seen where some errors occur 100+ million times within 24 hours and 1 billion times within a week!
Even if you don’t have 100+ million errors, in general you should be keeping an eye on what impact these higher volume errors might be having on your resources (CPU, Memory, Disk - when logging- A.K.A.”performance”), and the associated costs, especially when running in the cloud.
Log aggregators
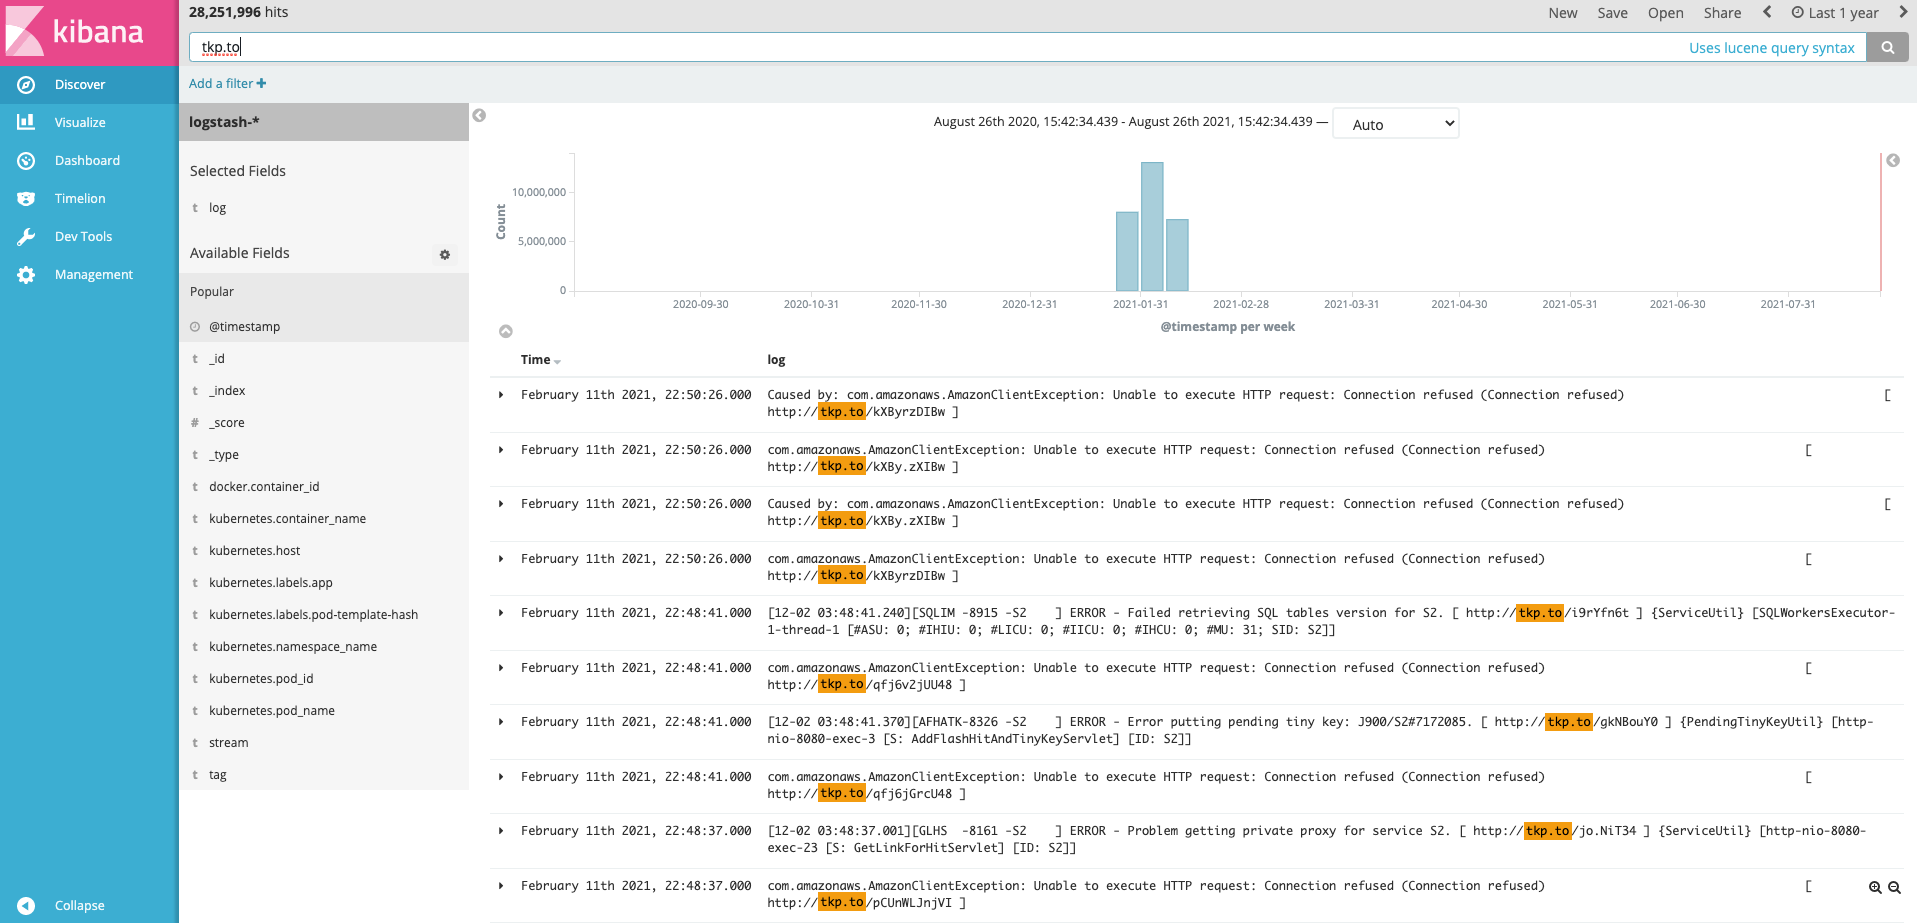
If you are used to troubleshooting issues via your log files and are using log aggregators, OverOps provides you with “tiny links” in your log entries. Those allow you to jump straight to the event within OverOps. The link provides you all the context around this log entry to help you resolve your issues much faster than using traditional methods.

New Events
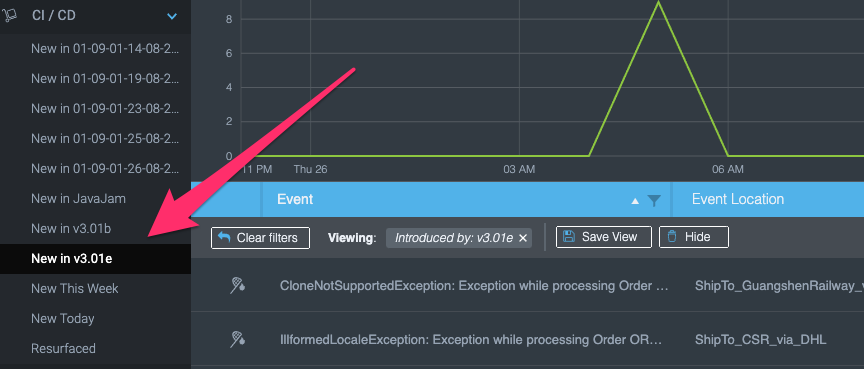
When a new version is deployed, we can show which events never occurred prior to this version. This tells you that these events were introduced with this new version so you can quickly review them and determine what is causing them. In this way, you can fix them before they potentially impact any of your customers. This is a great feature when using OverOps in your pre-prod environments or as part of your CI/CD pipeline process. You can even make your build process fail if this occurs to ensure you release good quality code to your production environments. Be sure to provide deployment information to use this feature!
CI/CD
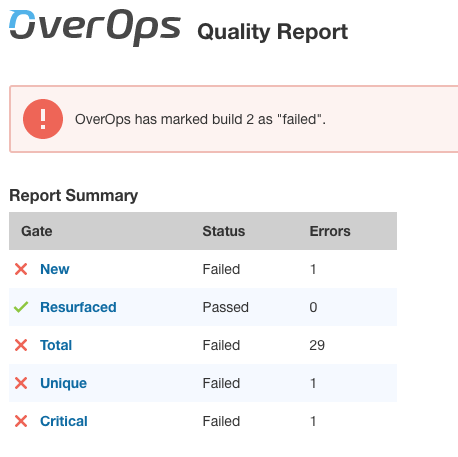
OverOps can also be integrated into your CI/CD solution like Jenkins. You can add OverOps Quality Gates to your process which would allow, for example, to fail builds based on criteria such as how many new errors were encountered. These thresholds are all configurable.
Static Code Analysis example, with SonarQube
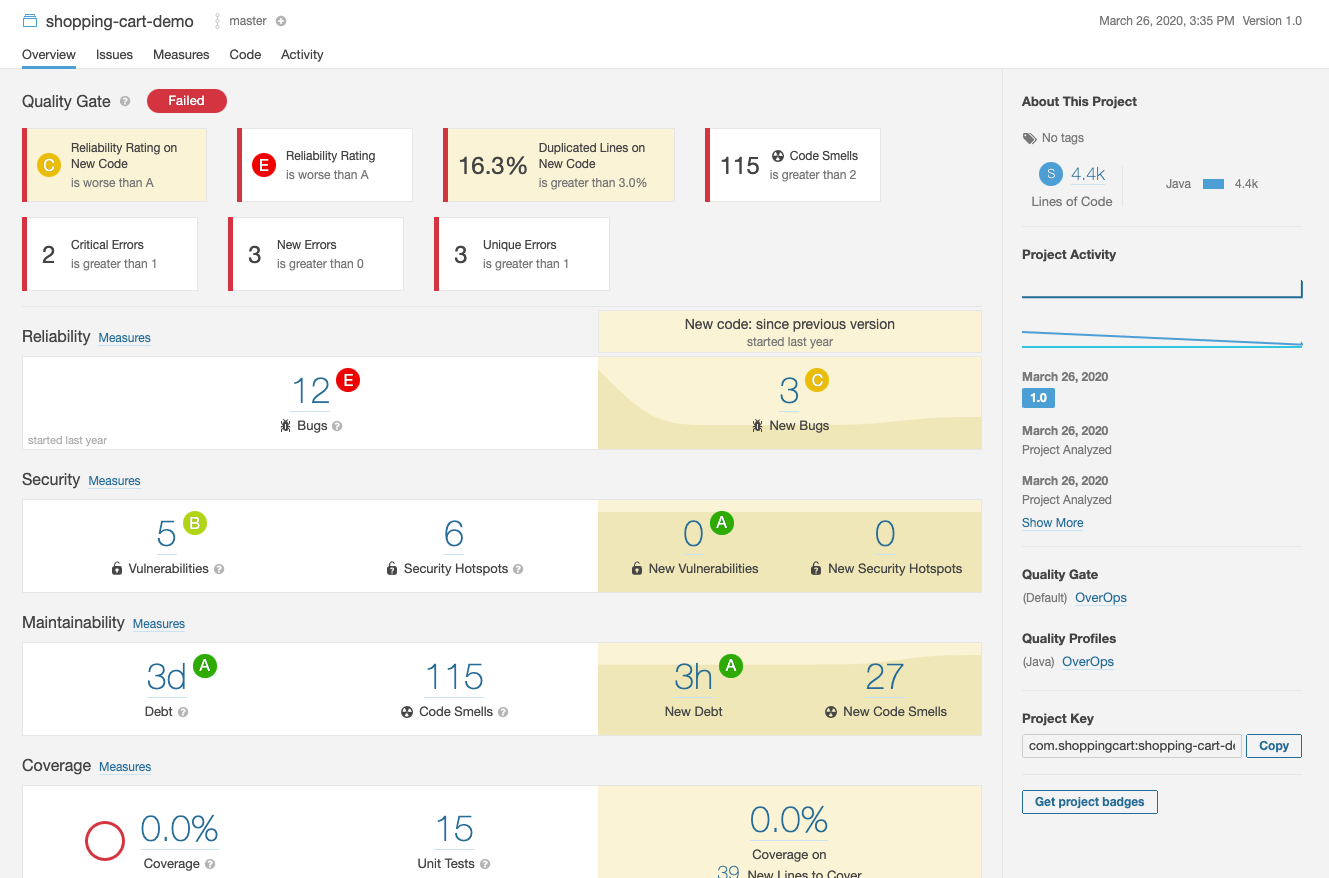
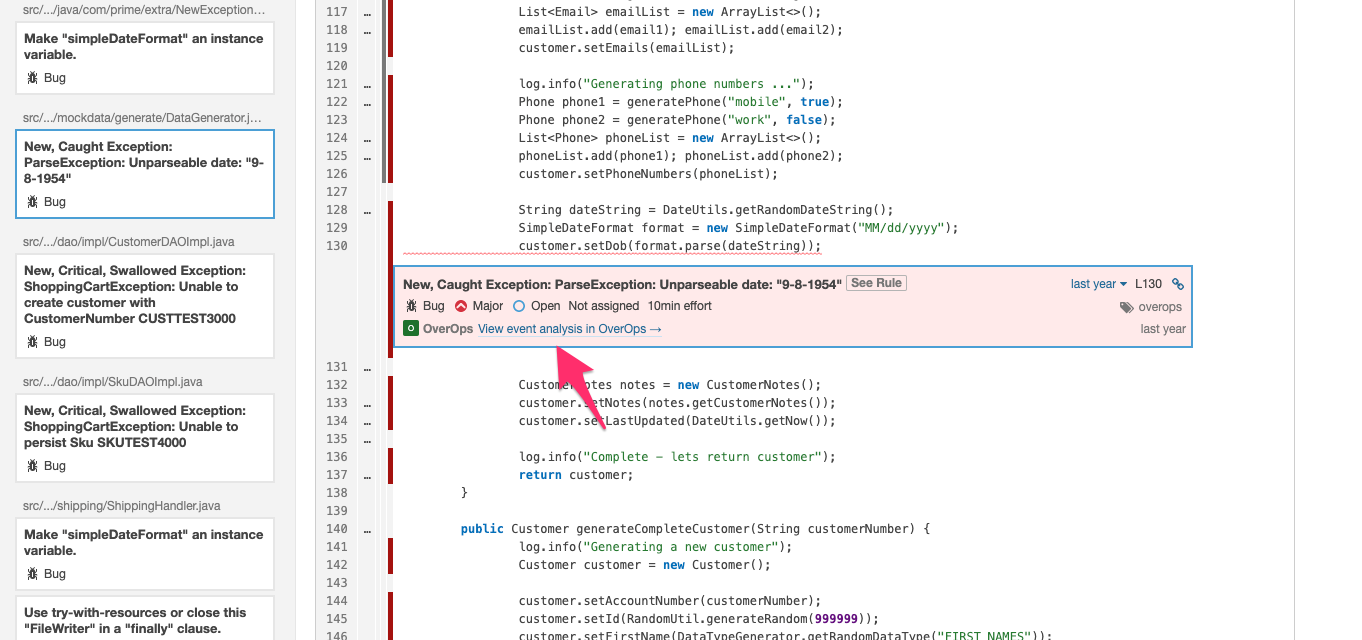
If you use a static code analysis tool such as SonarQube, OverOps can be integrated with it so that you get a complete view of your code through both static (e.g., SonarQube) and dynamic analysis (i.e., runtime with OverOps). Beyond just doing a static code analysis of your code, OverOps adds context on issues driven by runtime data issues in your code providing direct links into the ARC screen. You would never get this insight doing static code analysis alone.
Conclusion
OverOps allows you to continue to accelerate innovation, without sacrificing quality. If you have further questions, reach out here for a guided tour or to request a consultation. And learn how companies like Comcast and British Telecom rely on OverOps to ensure their customer-facing applications remain reliable.
Updated 12 months ago
