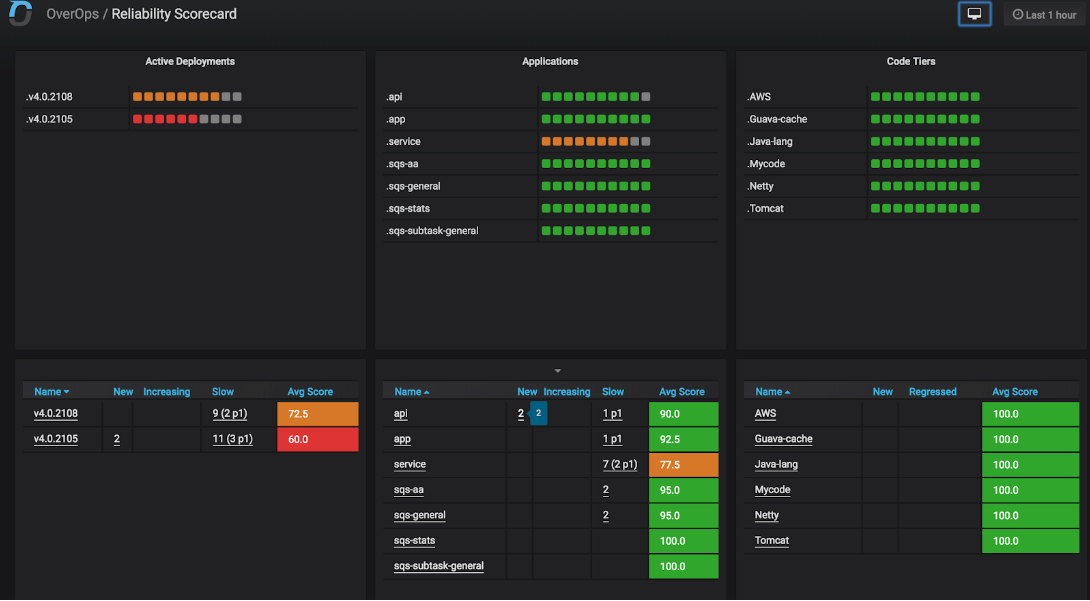
Introduction to the Reliability Dashboard
The OverOps Reliability Dashboard provides a full overview on any OverOps environment showing the reliability state of an application from the high level summary all the way to the drill down into what exactly is failing. This dashboard, which is built on Grafana, is available as part of the OverOps application and also can be integrated with your Grafana instance.
Home
Home is the main Reliability Dashboard that links to the available dashboards for different roles within an organization. It also displays the status of selected applications in the selected environment and a score if deployment running within the environment.
OverOps Reliability Report
OverOps provides information about new errors introduced, when existing errors regressed or spiked and when code slows down. This information is provided in 3 different dimensions for each selected environment(s):
- Applications - Each application (microservice or monolith) running within the selected environment(s)
- Deployments - Code versions
- Code Tiers - Code tiers (custom or 3rd party) running within the selected environment(s)

The Reliability Dashboards are built on the data collected by OverOps and provide an actionable report, which enables users to evaluate a service's reliability, to figure out anomalies, and to determine which parts of the system are unstable. Together, these capabilities make it possible to deploy fast and safely and “fail forward” along with the ability to perform full root cause analysis for the top priority items.
Out-of-the-box Dashboards
OverOps provides a set of out-of-the-box dashboards that enable you to examine the reliability of code across multiple environments (e.g., testing, staging, production); to easily spot anomalies, both severe and non-severe; and to drill down easily into their source, with a direct integration into the OverOps native Automated Root Cause (ARC) analysis module. The ARC shows the complete source code, variable state, DEBUG-level log statements and JVM / CLR / system state behind any log error, exception, and slowdown within a running application.
NoteOverOps comes pre-bundled with Grafana, which is activated when the backend is started. For prerequisites, refer to the Software and Hardware requirements.
This dashboard acts as a “cockpit” from which an entire environment or set of environments can be observed in real time, where the reliability of that environments is continuously analyzed and scored across three different dimensions: deployment, applications and tiers.
Learn more about how OverOps calculates the Reliability Score.
This dashboard provides a deeper visual analysis into the reliability and into any anomalies (e.g., new errors, regressions, slowdowns), with a target set of applications, deployments and tiers. This dashboard provides direct links into specific drill down dashboards, which enable teams to focus on specific anomalies, based on configured and automatically assigned severities.
This dashboard provides a breakdown of all points within the application code that are called by a third party or by JVM / CLR code to respond to an incoming foreground or background request. These points within the application code are known as application entry points or transaction handlers.
OverOps automatically detects all code entry points and collects live information around how many times they are called, their response times, failures, and more. Machine learning algorithms detect and highlight slowdowns and bottlenecks and provide an ARC analysis for each.
This dashboard lists all new errors introduced in the current time-frame. Each entry highlights when that error was introduced, its exact location in the code, and absolute / relative rate. An ARC analysis is provided for each error to help team distinguish between errors stemming from cod vs. infrastructure-related reasons. Each error is also assigned a severity level based on the thresholds set within the Settings dashboard.
This dashboard lists all errors that experienced a significant increase in the current timeframe. Each entry highlights when was that has increased, its exact location in the code and change in percentage between the current timeframe and its baseline period. OverOps provides an ARC analysis for each error to help team distinguish between errors stemming from code vs. infrastructure related reasons. Each error is also assigned a severity level based on the thresholds set within the Settings dashboard.
This dashboard provides a deduplicated list of all errors taking place within a target environment(is) and a set of filters that are similar in capability to the event console in https://app.overop.com.
This dashboard allows you to see how well applications and deployments are doing with respect to the four promotion gates by which reliability is measured over time, namely error volume, unique count, new errors, and regressions / slowdowns.
This dashboard provides a simple and effective way of comparing releases - or two instances of an application running on different nodes - with one another.
How to Access the Reliability Dashboards
OverOps Built-in Grafana
Reliability dashboards are integrated into OverOps product and can be accessed from the OverOps Dashboard by clicking the "Reliability Dashboards" icon in the top navigation bar.
Integrating with an External Grafana Instance
If you have an existing external Grafana instance, you can connect that instance to OverOps by following these instructions.
Additional Resources
Updated 12 months ago
