Event Graph
Introduction
A key component within the dashboard is the interactive graph, which visualizes the volume of the events included within the current timeframe and View. These are visualized through the Current View series (in green). Filtering events within the grid is automatically reflected in the graph to visualize the events currently viewed.

Reading the Graph
The Event Graph displays how certain metrics have been performing over time. The initial graphs hows you the trends for the total number of errors over the selected time span.

Setting Graph Timeframes
You can further customize the graph by changing the timeframes, selected applications, columns and more and saving them as a new View as described below.
- Last Hour - shows all events occurring within the last hour timeframe.
- Last Day - this View provides a bird's eye view of all errors occurring within your application(s) over the last 24 hour window.
- New Today - this View enables you to see all new errors that were introduced into your application(s) over the last day. This is a useful to use following a deployment to be able to see exactly if/what new errors were introduced to triage and analyze the most critical ones.
- New This Week - this View enables you to see all new errors that were introduced into your application(s) over the last week. This is a great view to use following one or more deployments to be able to see exactly if/what new errors were introduced to triage and analyze the most critical ones.
Using the Graph
Whenever you select events in the grid they will be automatically visualized in the chart as the Current Selection series (in purple). Comparing both series enables you to see the effect of any number of errors' locations on the whole.
Each series can be Pinned and Split:

Pinning a Series
The current selection and view series can be pinned  to keep it a separate series on the chart, even if you change selection. For example you may want to filter the Events List to show only NullPointerExceptions. You can then Pin the current view and clear the filter to contract the volume of NullPointerException related to the overall number of errors within a specific server, application or timeframe.
You can use the clear  button on the top right of the chart to remove all previously pinned series.
Splitting a Series
You can use the split function  to break any composite chart series such as the current view, selection or even a an error location which is being called into from multiple entry points to show the top 5 contributors as series on the graph. This enables you immediately see which ones have the most impact and may need to be dealt with first.
Hiding a Series
Click the series legend to toggle its visibility on and off.

Splitting the current View displays the IllegalStateException (orange) as the key contributor
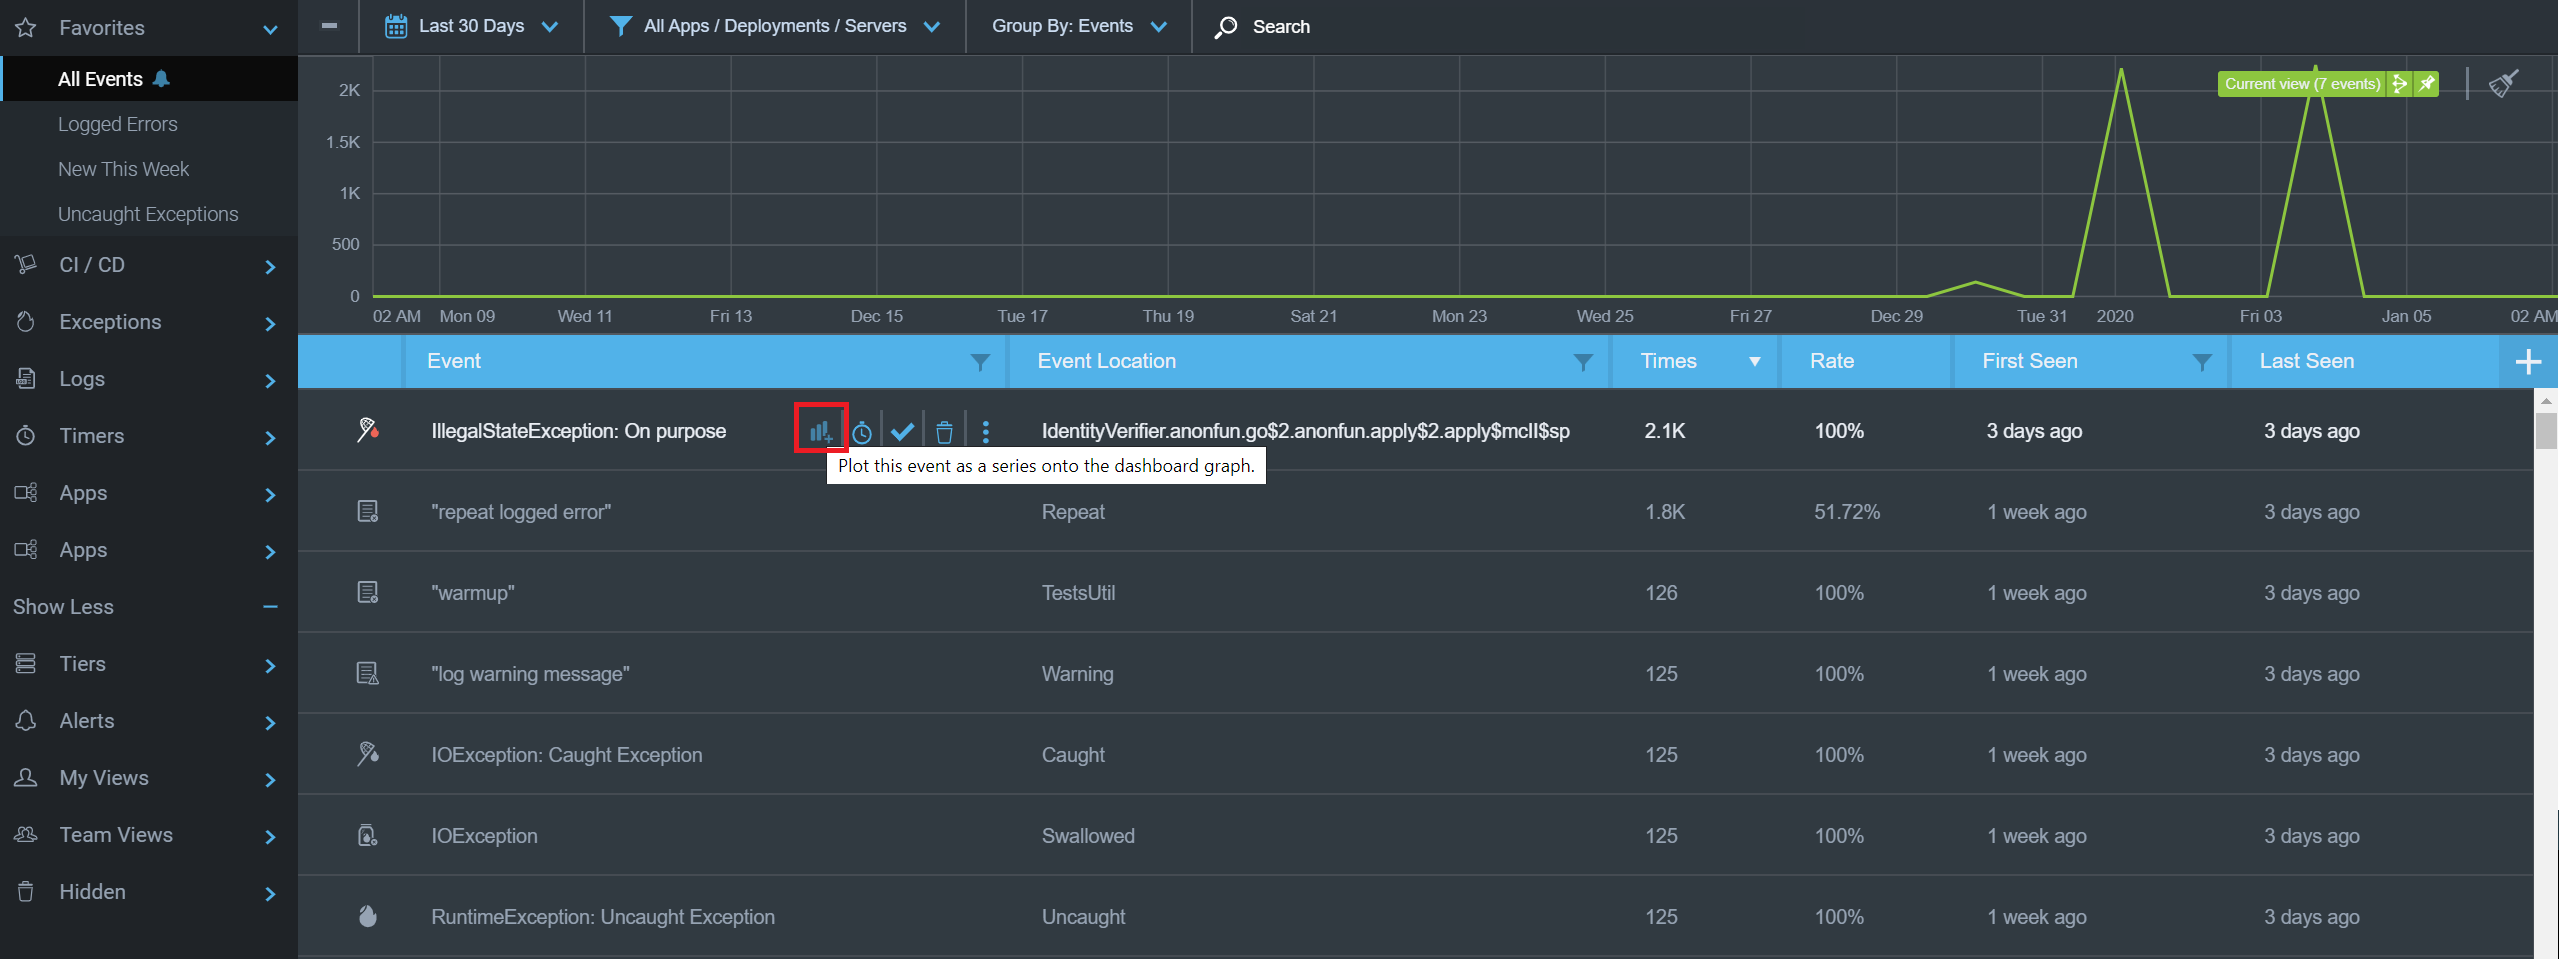
Adding an Event to the Event Graph
You can add a new event to the Event Graph by hovering over the event in the event list and clicking the Graph Button as shown below.
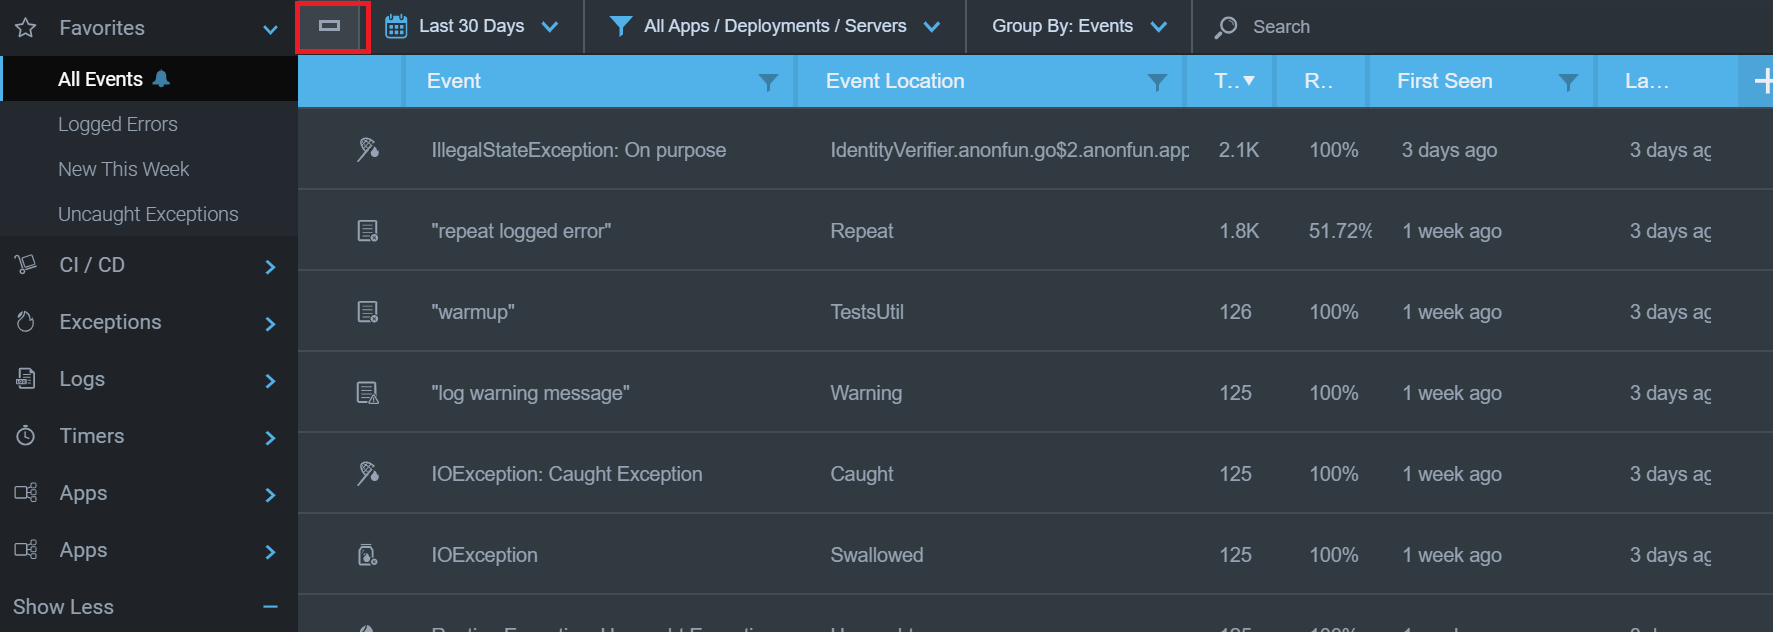
Collapsing the Event Graph
The Event Graph also lets you collapse it so that it's not displayed on the screen, and then re-deploy it when needed as shown in the image below.
Related Articles
Updated about 1 year ago