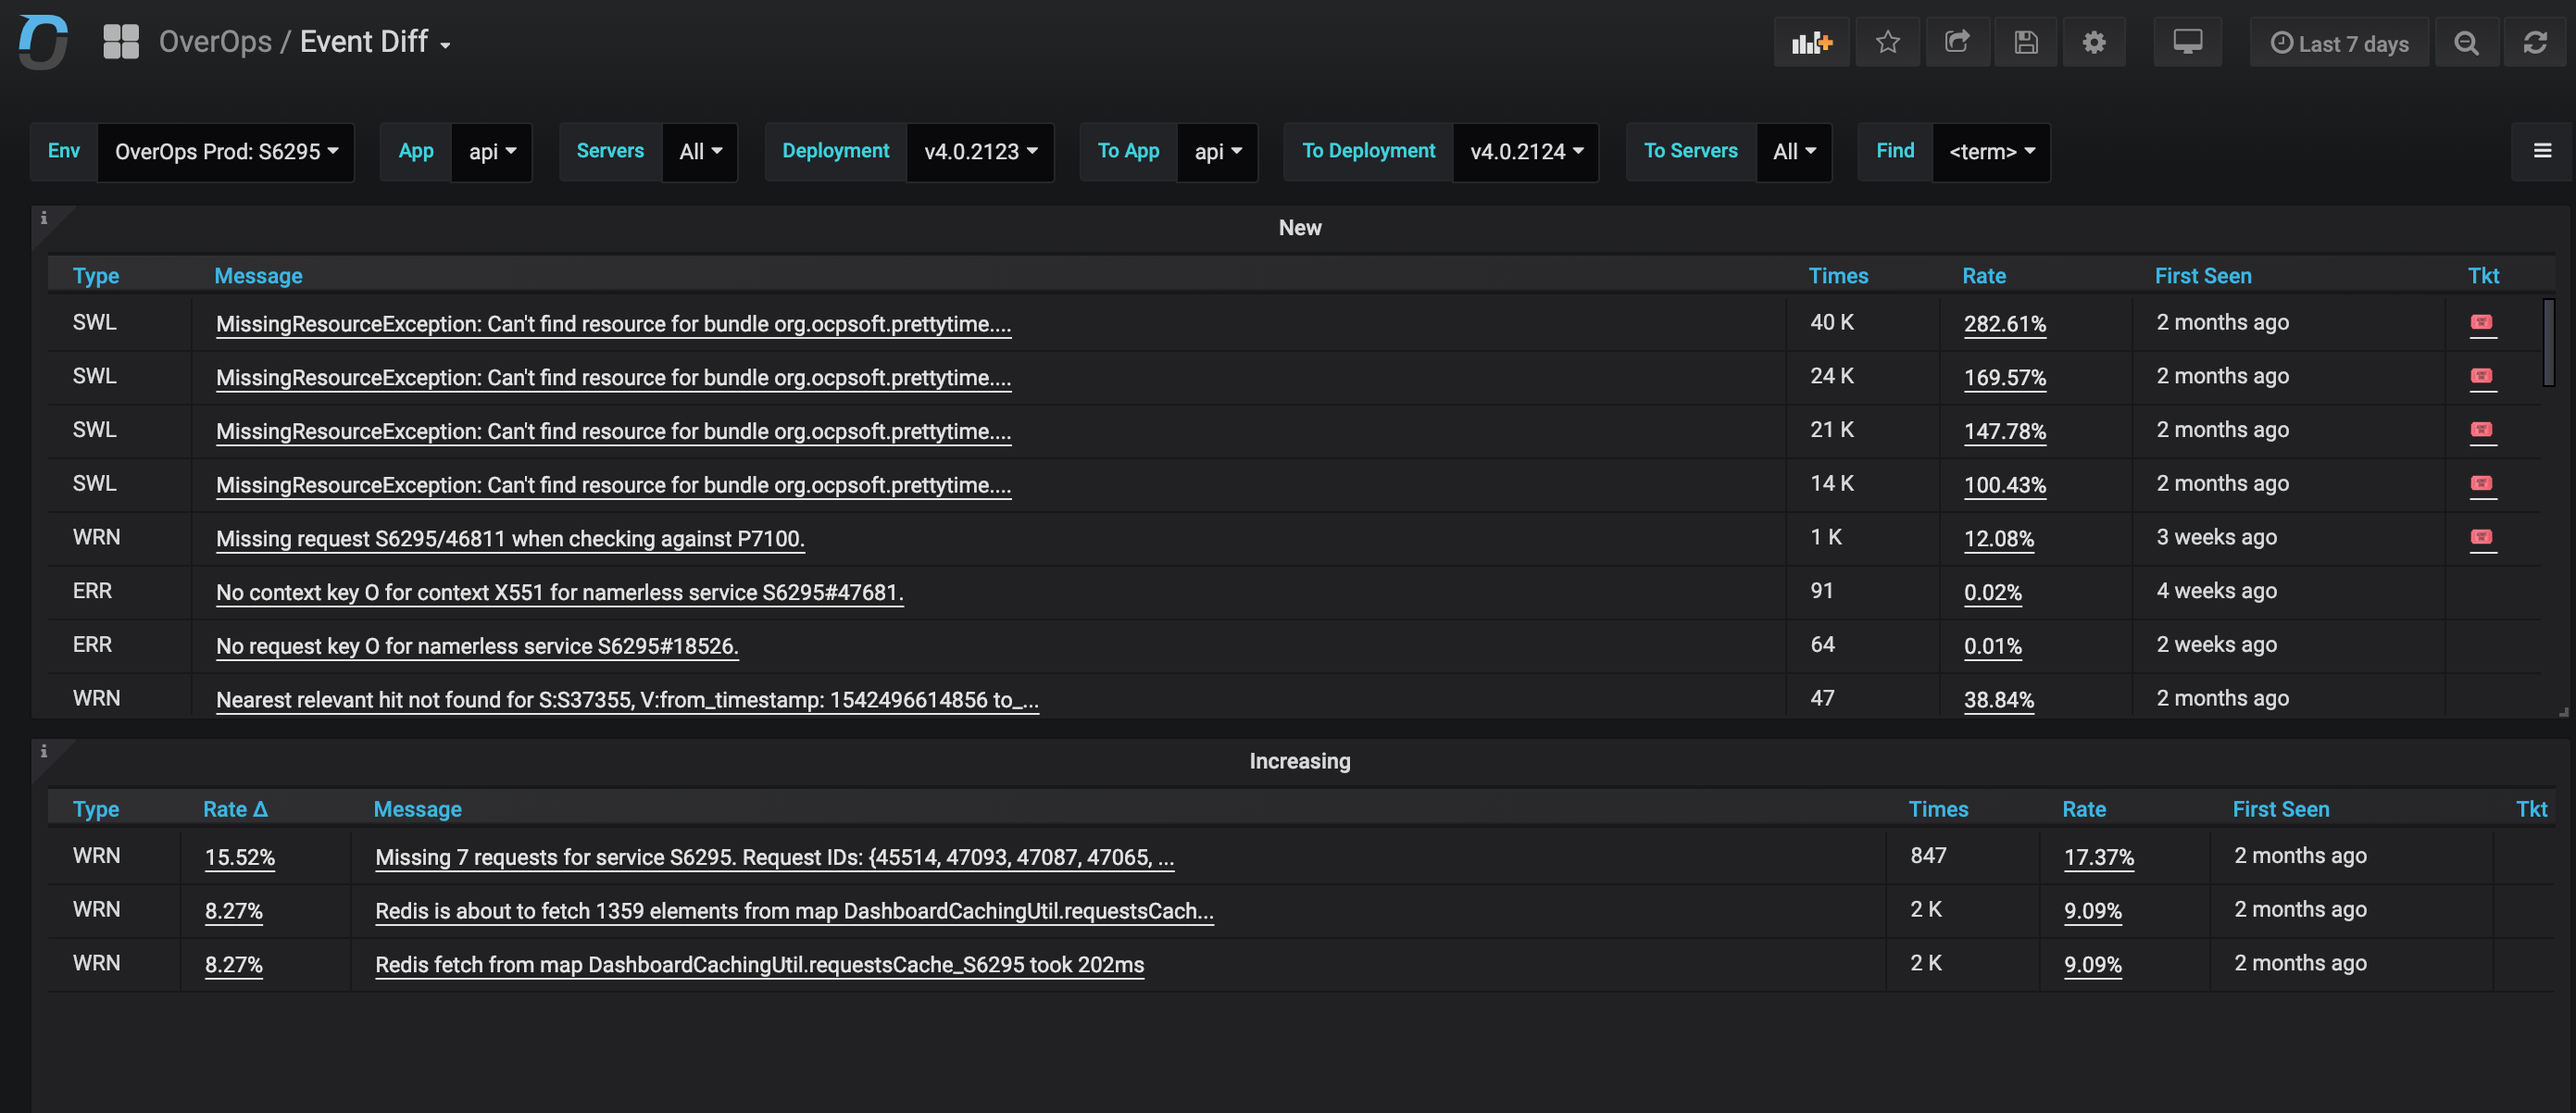
Event Diff Dashboard
The Event Diff Dashboard allows to compare between the events set of two different groups of Applications/Deployments/Servers.

Selecting Data to Compare
- Select one of more environments to compare at the top bar.
- Select Base group of Applications/Servers/Deployments using the filters at the top bar (For example: App --> Api, Deployment --> V1.2.0)
- Select Target group of Applications/Servers/Deployments using the filters at the top bar (For example: To App --> Api, To Deployment --> V1.2.1)
New Events
All events that exist in the target set and don't exist in the base set, will be listed at the New Table.
Increasing Events
This table will list details of all events which volume was increased in the target set (including the rate delta).
Slowdowns
Scroll down to the slowdowns table that lists all events that are slowing in the target set comparing to the base set.

TimeDiff
TimeDiff enables you to compare the behavior from today to one hour, one day, and one week ago.
Event Diff Dashboard JSON ModelCustomize the dashboard, or integrate any of the widgets in it into your grafana using the Grafana JSON Model of this dashboard.
Updated 12 months ago
