Event List
Introduction
The Event List displays all the events within the current timeframe and View. Each row provides deep contextual information about the event type, location in the code, and impact in terms of volume and spread across your application.
Filtering Events per Timeframes
From the Dashboard you can filter the event list according selected timeframes.
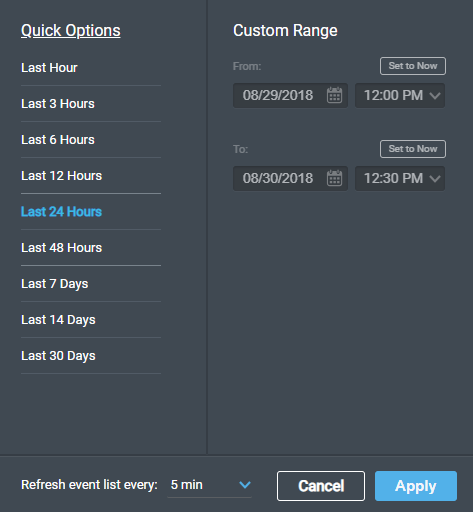
To set a timeframe to filter:
- In the Dashboard, from the top of the page, click
 .
. - From the timeframe dialog box, choose an interval between Last Hour to Last 30 days (Default: Last 24 Hours)
-or- - Set a custom range to display events that occurred within these timeframes.
About Timeframes
- Last Hour - This filter is useful to provide a real-time view of the behavior in the application.
- Last 24 Hours - This filter reveals any spikes or fluctuations in events as a result of a new deployment or environment change/outage.
To keep the selected display up-to-date, set the frequency in which to refresh the Event List, between 1 to 60 minutes.
The Dashboard also features filtering events that were introduced recently. To display new events only, from the Dashboard Views:
- New Today - Displays all new events that were introduced into your application(s) over the last day. This is a great view to use following a deployment to be able to see exactly if/what new events were introduced to triage and analyze the most critical ones.
- New This Week - Displays new events that were introduced into your application(s) over the last week. This is a great view to use following one or more deployments to be able to see exactly if/what new events were introduced to triage and analyze the most critical ones.
Setting a Timeframe from the Graph
From the graph, select the area of the target timeframe on which to focus:

Selecting an area is especially useful for zooming in on a spike in events.
Event List Columns
The events in the Event List can be displayed according to a variety of attributes. You can filter the columns to display and by which to sort the events.

For each event the grid displays the following values:
The following columns are available, displaying the described values for each event:
- ID - The Event unique ID.
- Event - The name of the event. In case of an exception this is the exception class name (e.g. AmazonException, NullPointerException, etc.) and it includes the exception message (hover over the event column and see the full exception message). In case of a log error or warning this is a sample message for that event (e.g. "Could not complete operation for user...").
From this column, you can filter event according to their type with the following possible values.
NoteThe following events are currently supported only on the JVM languages listed here:
- HTTP Error = HTTP communication errors
- Timer = Events that exceeded thresholds configured under Timers
- Custom Event = Events that occur in the custom SDK
| Event Type | Description |
|---|---|
| Caught Exception | Exceptions that were captured and dealt with by the user’s application |
| Uncaught Exception | Exceptions that were not captured by the user’s application |
| Swallowed Exception | Exceptions that were captured but ignored by the user’s application |
| Log Error | Events logged as Errors in the user’s applications |
| Log Warning | Events logged as Warnings in the user’s applications |
| HTTP Error | HTTP communication errors |
| Timer | Events that exceeded thresholds configured under Timers |
| Custom Event | Events that occur in the custom SDK |
- Event Location - The application class and method in which the event occurred. OverOps displays the last location in the application code calling into the error (vs. 3rd-party code), even if the actual error is generated by a 3rd-party or core JDK frameworks, to direct attention to the code that is being impacted within your application. Event location can also be filtered according to packages.
- Entry Point - The application class and method at the top of the call stack leading to the event. The entry point demonstrates the business transaction/application flow impacted by the event.
- Times - The number of times this event has occurred. This value indicates the severity of the event. The Times column adjusts itself to the current timeframe, meaning it dynamically reflects the number of times this event has occurred within the configured timeframe (e.g. last hour, last day, 10:30-11:00 pm, etc.).
- Event Location Calls - The number of times the method in which the event occurred was invoked.
- Rate - The percentage of time when this event occurs out of calls into the event location. This value is calculated as Times/Event Location Calls. It provides powerful context as to how many times the event occurs compared to calls into the actual code.
- First Seen - The time in which this event was first detected in your environment by OverOps.
- Last Seen - The last time this event was detected in your environment. This value indicates whether this event is still impacting your application.
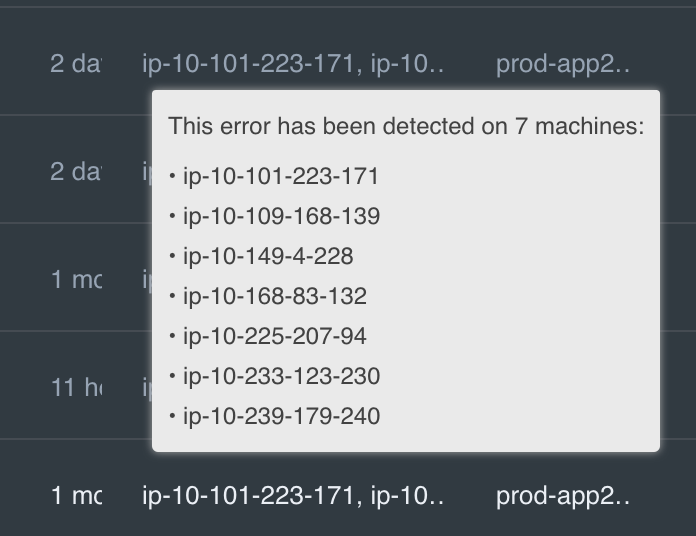
- Servers - The list of servers in which this event was detected. Click here to learn how to assign names to the monitored servers.
Hover over the Applications or Servers column to see which Servers or Applications have reported this event:
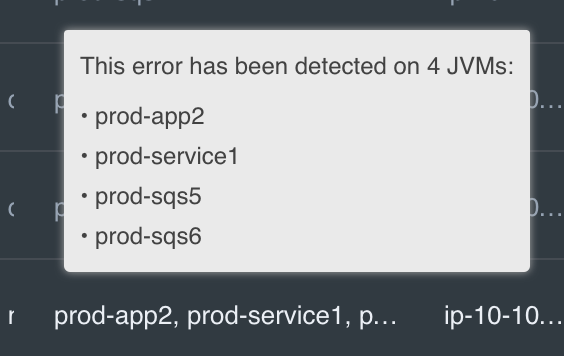
- Applications - The list of applications (e.g. "Producer-Service", "Consumer-Service", Web-frontend", etc.) in which this event was detected. Click here to learn how to assign application names to the JVMs.
- Deployments - The list of deployments (e.g. "stage-1", etc.) in which this event was detected.
- Introduced By - The deployment in which this event was introduced.
- Labels - Labels that may have been added to events.
- Notes - Notes that may have been added to events by team members.
Sorting and Filtering the Grid
The event list can be searched and sorted to concentrate on the errors that are most relevant to you.
To sort and filter events, use  and
and  at the top of each column.
To choose filters in the columns:
- Where applicable, from the filter heading, click
 to choose elements to filter and then click Apply.
The filters appear in the Filter bar below the event list header.

- Sort by First Seen - Sorts event according to the newest events introduced into your application within the last day, week, etc. This enables you to keep track of when new errors have been introduced to your environment.
- Sort by Times - Sorts events according to those happening most frequently within the current timeframe.
- Sort by Last Seen - Sorting by Last Seen combined with the Last day/hour timeframe, displays the errors happening in real-time within your application.
- Filter Type to Uncaught Exceptions - Filters exceptions not handled by your code, which may lead to undetected failures.
- Filter by Entry Point or Error Location - Filters events that were originated or called in into your code from specific locations.
- Filter by Server/Application - Filters the impact and the level of errors impacting a specific set of monitored servers or JVMs that you tagged with application names.

Filters can be saved as Views and shared with team members to highlight the important events and applications.
Click here to learn more about Views.
Customize Event Views columns and its filters
The Event View can be customized to fit the user's needs by adding and removing the columns they want to see.
##To set/remove the Event List columns:
- From the + at the top-right of the Event List, choose the columns to display in the Event List and click Apply.
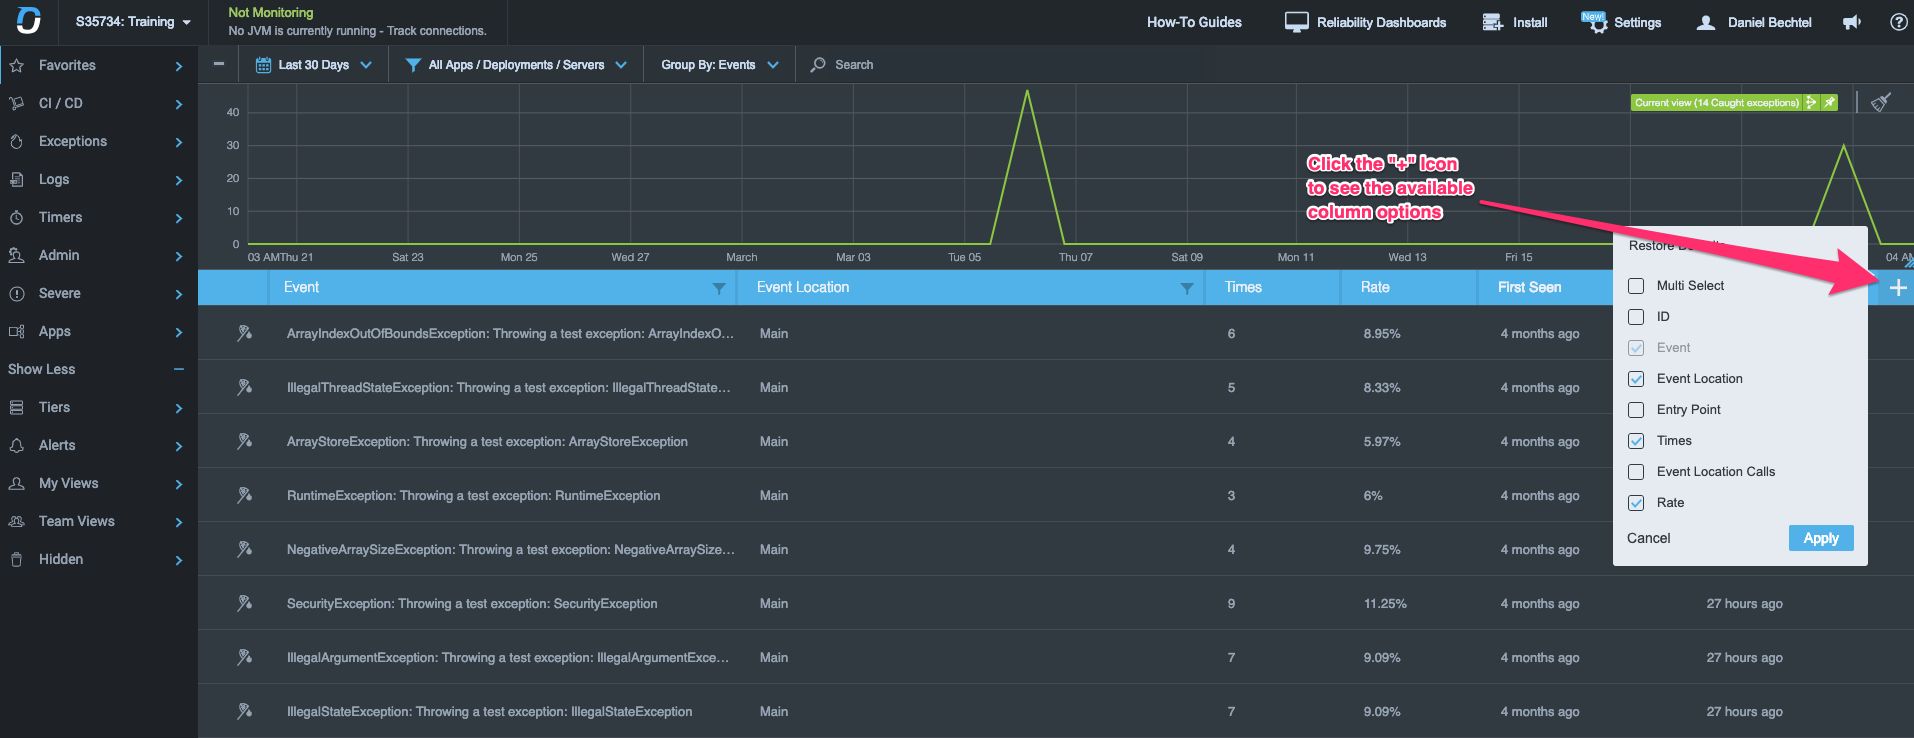
The selection is saved as in the Views settings.
#Searching the Event List
The Search box enables you to search through the application for events according to event type, name (including the event's message), location and entry point. The search box uses auto-complete to make searching easier.

Related Articles
Updated about 1 year ago