Views Pane
Introduction
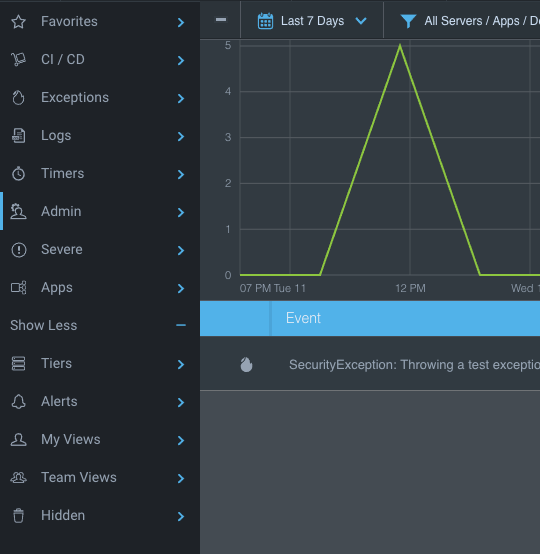
Views enable you to customize the Event Explorer into accessible Views, which can then be shared with other team members directly from the Views Pane located on the left side of the Dashboard.
Views encapsulate the grid columns, the search phrase, sorting, filtering, graphs, servers and applications, which enables you to filter for a specific application and types of errors (e.g., HibernateException, NullPointerException, etc.) and to save that filter as a View for future use.
Views Pane
View Columns
While the columns displayed in the Views are set by default, you can add additional columns by clicking the + sign on the right hand side of the screen and selecting them from the popup menu.
Categories
Categories, which are represented by folders in the Event Explorer, provide you with a way of collecting OverOps Views into dedicated folders so that you can find Views with related content in one place. New Views are gathered under My Views, and any View can be added to Favorites for your convenience. Categories can be dragged up and down to appear above or under the Show more / Show less button.
Default Categories
OverOps provides a number of default categories, each with a set of filters you can use to focus on a specific class of errors. These include:
- Exceptions - This Category includes Views for the types of exceptions recorded by OverOps, as well as All Exceptions:
- Uncaught Exceptions - Exceptions that were not captured by the user’s application
- Swallowed Exceptions - Exceptions that were captured but ignored by the user’s application
- Errors - Exceptions thrown by the core Java framework (i.e. java.util., java.lang.) or .NET framework in the current time frame. This is an especially powerful view to detect exceptions which for the most part represent code defects that your application should not be normally experiencing such as: * NullPointerException, IndexOutOfBoundsException, InvalidCastException and more.
- HTTP Errors - HTTP communication errors
- Logs - includes Logged Errors and Logged Warnings
- Logged Errors - All logged warnings within the current timeframe. This is a useful view for seeing whether or not there's been a spike in the number of warnings within the current timeframe.
- Logged Warnings - All logged warnings within the current timeframe. This is a useful view for seeing whether or not there's been a spike in the number of warnings within the current timeframe.
- Timers - This Category includes all the Timers in the Event Explorer. Timers are used to notify when and why a method's execution time exceeds a target millisecond threshold.
- DB Exceptions - the most common DB error types to enable you to detect new and increasing DB errors within your application(s). These include: java.sql.*, MySQL, PostgreSQL, MongoDB, H2, Derby, CouchBase, Riak, Memcached and Amazon SimpleDB/DynamoDB exceptions.
- Network Errors - the most common network error types to enable you to detect new and increasing networking errors within your application(s). These include: javax.net.*, Finagle, Kafka, JBoss, Mongo, Undertow, Cascading and Apache Catalina, Coyote and Jasper exceptions.
- Alerts - Includes all Views with alerts configured for them
- My Views - Includes all the personal custom Views you created for yourself. This is the default category for private/personal views which are created by you and haven't been assigned to a specific category (based on the view's permissions).
- Team Views - Includes custom Views shared with your team members. This is the default category for team views which haven't been assigned to a specific category.
- Labels - Includes labelled events
- Hidden Events - Includes Resolved and Hidden events.
Admin Categories
Views also include categories that are managed by admins:
- Admin - Includes custom Views shared between team admins (these views aren't visible to member roles). This is the default category for admin views which haven't been assigned to a specific category. See Admin Category (Admins Only) for details.
- CI/CD - This category includes New Today, New this week, Resurfaced. Additionally New events are added for each new deployment via an automatic admin capability run using a UDF. Refer to Deployment Routing for details.
- Apps - A UDF maintained Category, this UDF is executed every 5 minutes and creates Views for live applications. See Application Routing for details.
- Tiers - A UDF maintained Category, this UDF runs every time a new event is first seen, categorizing it based on where it originated (DB, Infra, Framework, etc.). See Tiers Routing for details.
Favorites Category
This category enables you to collect your most used Views in one folder. The default favorites Views are: All Events, Logged Errors, New This Week and Uncaught Exceptions.
To add a View to Favorites:
From the View, click the toolbar options and select Add to Favorites.
To remove a View from Favorites:
From the View, click the toolbar options and select Remove from Favorites.
Hidden Category
The Hidden Category includes all events that you've chosen to hide, all resolved events, and event snapshots triggered by AppDynamics (these events will not trigger an additional alert in OverOps).
Views Popup Menu
You can apply additional actions to the existing Views using the popup menu.
- Stand next to the View you wish to apply the actions to display the three dots next to the View.
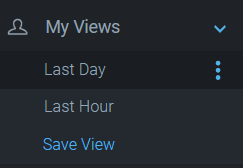
- Click to display the popup menu
- The popup menu options differ depending on the View's current status: if there is already an alert attached to it, you'll get the option "Edit Alerts". If no alerts have been set, you'll see "Add Alerts" instead. To learn more about alerts, see Add Alerts .
- You can also choose to add the View to your Favorites folder/category.
- Finally, you can also duplicate the View if it's not related to a time filter.
Creating Custom Views
You can further customize Views by changing the selected timeframe, applications, grid columns and more, and then saving them as a new View.
Note that any change you make to a specific View, such as changing the time filter, will then emphasize the View by displaying it as bold.
You can save any combination of grid filters, search phrase, visible columns, sorting and selected servers/applications/deployments as a persistent Viewת which you can name and reuse. This View can also be shared with team members or be private and visible only to you. Each view has a name, description and a toggle to control whether it is visible to your teammates or only to you:
- Adding columns to Views: Any columns you add to the views will be maintained across all views and between sessions.
- Changing the time filters: When you move to a view that changes the current time filter, this change will appear as emphasized
Filtering Views by Timeframe
Events in the Views can be further filtered by timeframes to create new Views:
- Last Hour - shows all events occurring within the last hour timeframe. This view is useful for giving you a real-time view of the behavior in your application.
- Last Day - this View provides a bird's eye view of all errors occurring within your application(s) over the last 24 hour window. This is useful view to see any spikes or fluctuations in errors as a result of a new deployment or environment change/outage.
- New Today - this View enables you to see all new errors that were introduced into your application(s) over the last day. This is a great view to use following a deployment to be able to see exactly if/what new errors were introduced to triage and analyze the most critical ones.
- New This Week - this View enables you to see all new errors that were introduced into your application(s) over the last week. This is a great view to use following one or more deployments to be able to see exactly if/what new errors were introduced to triage and analyze the most critical ones.
To create a custom View:
- Choose the relevant grid filters, search phrase, visible columns, sorting and selected servers/applications/deployments.
- When you're ready to save the view, click Save View either in the toolbar in or under the new View that appears in the Views pane (both are marked in red below).
Save View
This opens the "View Settings" window.
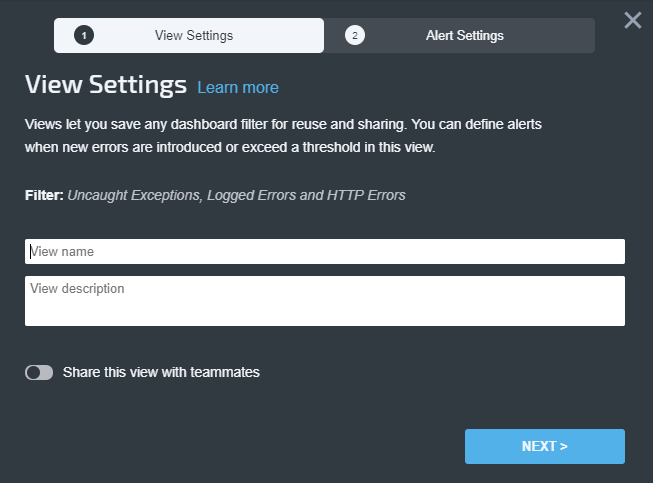
View Settings
- Click Next.
- From the Alert Settings tab, add Alerts for the View, for details, click here.
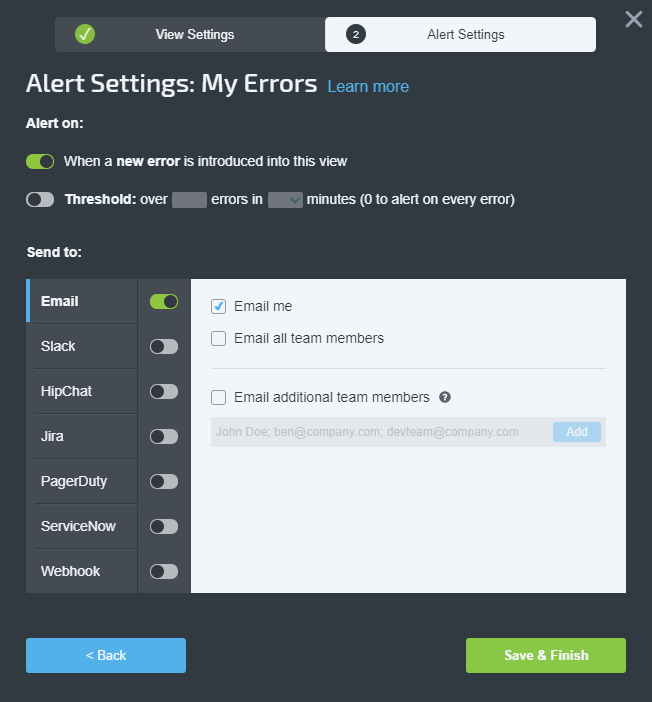
- When finished, click Save & Finish.
Editing Views
Sometimes the filters you used to create a specific View become obsolete or you need to include new filters by editing an existing View.
- In the Views pane, hover over the View you wish to edit, and click that View.
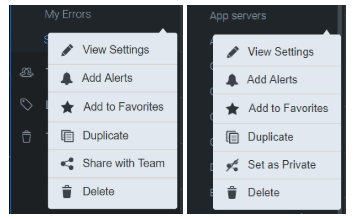
- Select View Settings.
The View Settings dialog box opens. - Make necessary changes and click Save & Finish.
To share View with team members:
- From the Views pane, hover over the View, and click the toolbar options.
- Select Share with Team.
The View is moved to Team Views - To hide View from team members, select Set as Private.
To edit View Alerts:
- From the Views pane, hover over the View, and click the toolbar options.
- Select Add/Edit Alert.
The Alert Settings dialog box opens. - Make necessary changes and click Save & Finish.
To delete a View:
- From the Views pane, hover over the View, and click the toolbar options.
- Select Delete.
- Click Yes to confirm.
Related Articles
Updated 12 months ago
