SonarQube Integration
Introduction
SonarQube is an open-source platform developed for continuous inspection of code quality. SonarQube performs automatic reviews with static analysis of code to detect bugs, code smells (i.e., any characteristic in the source code that could indicate a deeper problem), and security vulnerabilities on 20+ programming languages.
The integration between OverOps and SonarQube is simple to set up; when configured, the OverOps plugin enables you to view events detected by OverOps in the configured project. Along with rich event data, the OverOps plugin provides OverOps Quality Gate measurements, which are detailed in the next sections.
NoteSonarQube integration with OverOps is currently supported only on Java.
Requirements
- OverOps version 4.48 or later
- SonarQube version 7.9.1 or later
Installing the OverOps Plugin
To install the plugin manually, download the latest version to the SonarQube server's extensions/plugins directory and restart the SonarQube server.
Setup
Follow the next steps to set up the OverOps-SonarQube integration.
Activate the OverOps Event Rule
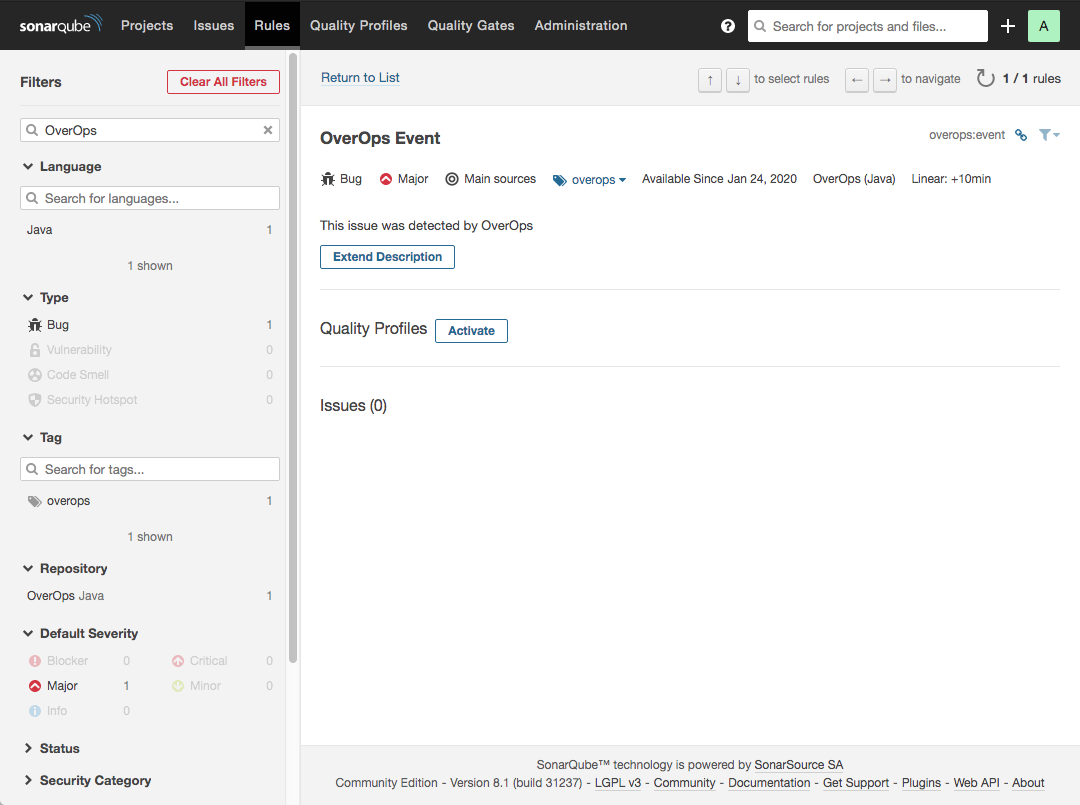
The plugin adds the OverOps Event rule for Java. To enable the plugin to create issues when scanning your code, you’ll need to activate the OverOps Event rule for the Quality Profile used in your project.
Configure Quality Gates
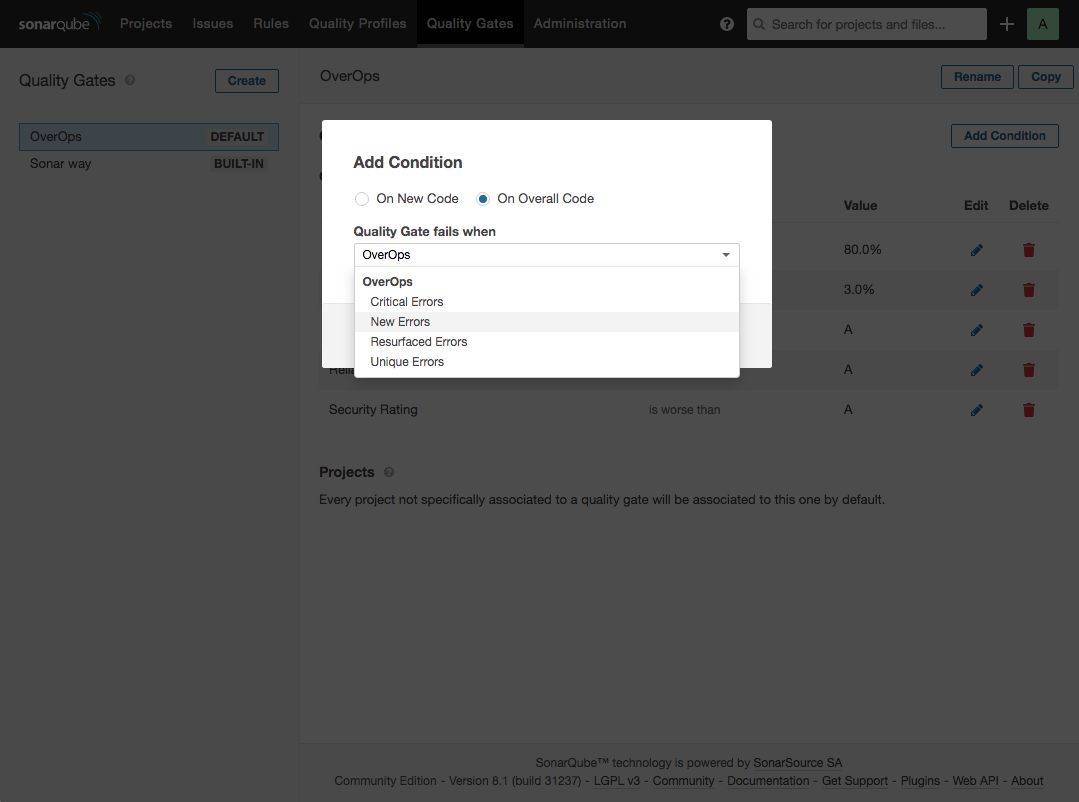
The OverOps plugin adds four metrics that can be used as Quality Gate conditions, including Critical Errors, New Errors, Resurfaced Errors, and Unique Errors. For more details about these gates, see OverOps Quality Gates.
Configure the Plugin
The plugin is configured using Analysis Parameters, which can be set in multiple places at both the global and project level.
NoteIn addition to the OverOps properties listed below, you’ll also need to set the
sonar.host.urland authentication parameters. See Analysis Parameters for details.
Name | Property | Default | Description |
|---|---|---|---|
API URL |
| api.overops.com | The complete URL including port and protocol of the OverOps API |
App URL |
| app.overops.com | The complete URL including port and protocol of the OverOps UI |
API Token |
| The OverOps REST API token to use for authentication. | |
Environment ID |
| The OverOps environment identifier | |
Application Name |
| Application Name as specified in OverOps (optional) | |
Deployment Name |
| Deployment Name as specified in OverOps. If blank, sonar.buildString is used | |
Critical Exception Types |
| NullPointerException,IndexOutOfBoundsException,InvalidCastException,AssertionError | A comma delimited list of critical exception types |
Ignore Event Types |
| Timer,Logged Warning,Logged Error | A comma delimited list of types of events to ignore |
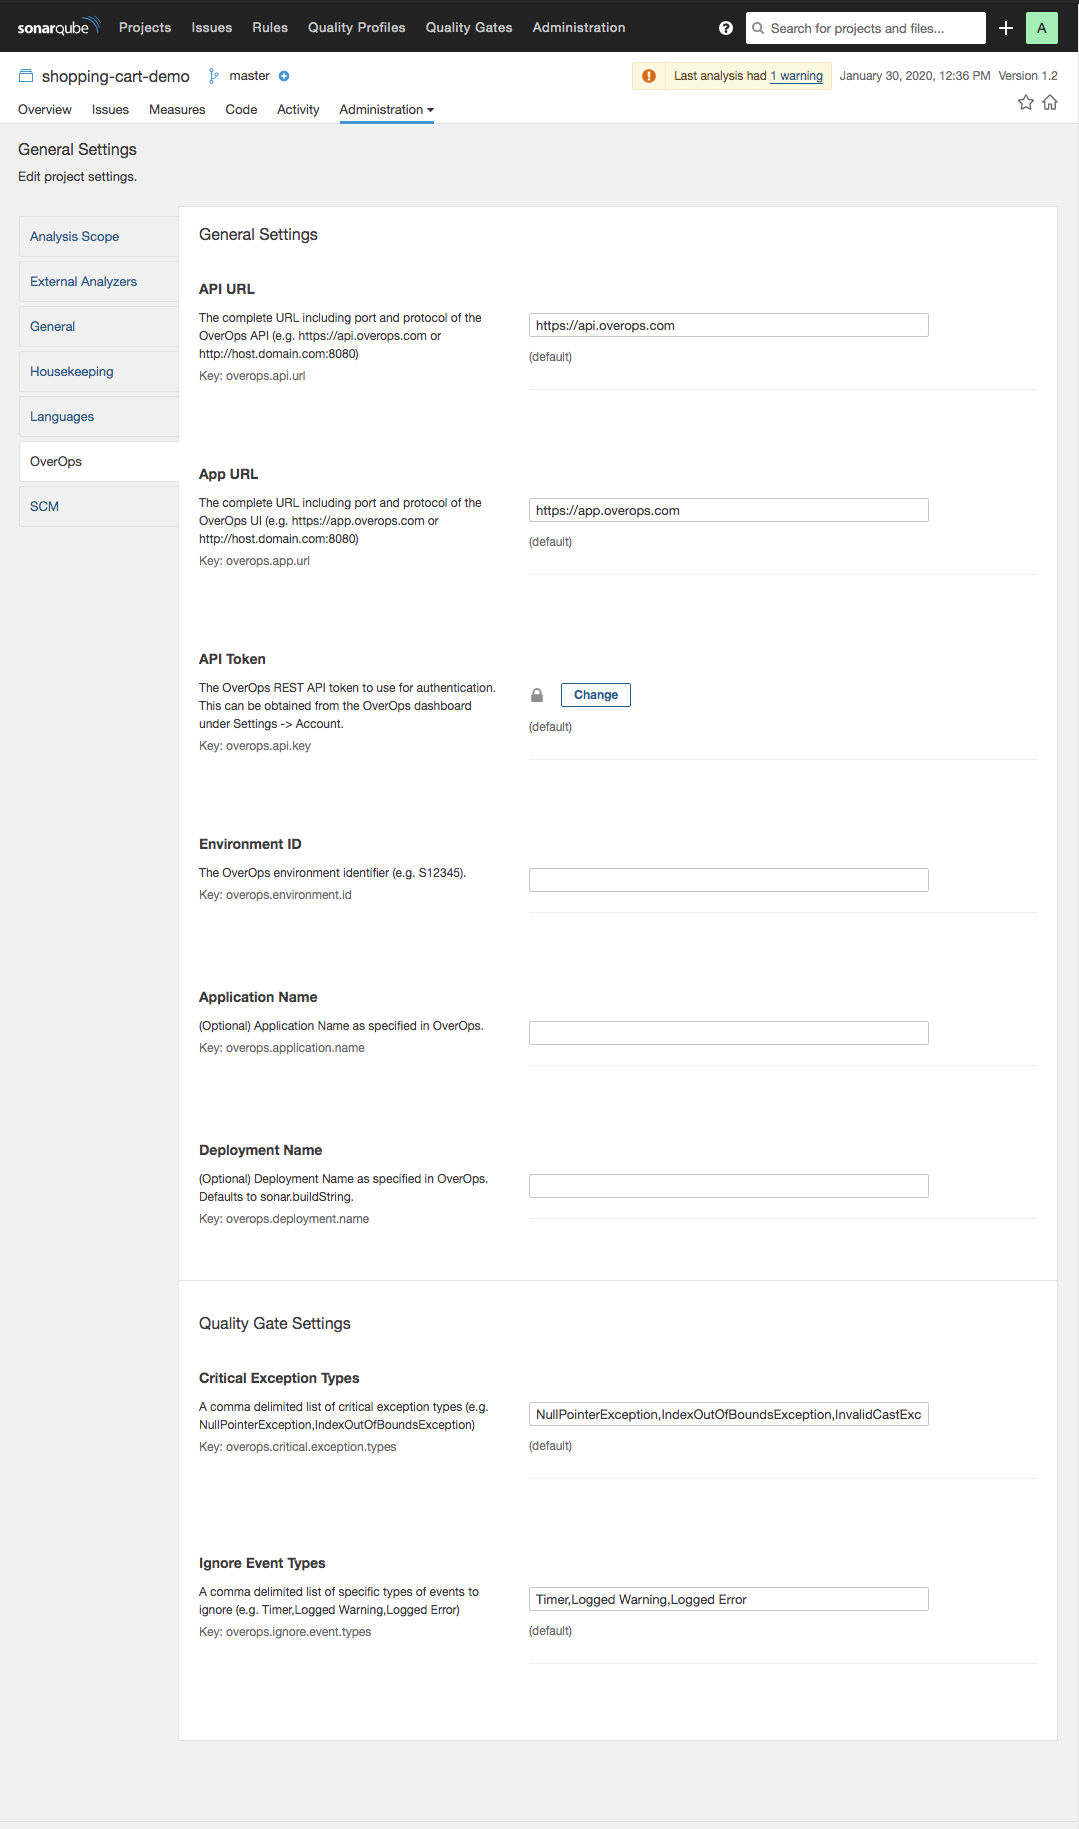
Configure the OverOps plugin in SonarQube
Running the Plugin
Scan Your Code
Because OverOps isn’t a static code analysis tool, to analyze your code, your code must be exercised by tests run prior to the Sonar Scanner. When running tests, verify that the OverOps Micro-Agent property deployment name matches the deployment name configured in the plugin. If you haven’t set a deployment name in the plugin, the sonar.buildString will be used instead.
Anonymous jobs are not supported. You must set authentication parameters when running the scanner. Links to the ARC screen are added as issue comments after the Sonar Scanner has finished using the credentials provided.
See Analyzing Source Code for documentation on how to run SonarQube.
Viewing OverOps Data in SonarQube
You can view OverOps data in SonarQube as quality gates, issues, and metrics.
##Quality Gates
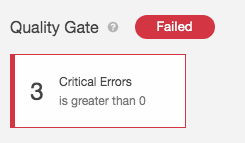
OverOps Metrics that count the number of New Errors, Critical Errors, Resurfaced Errors, and Unique Errors can be used as Quality Gate conditions.
Here are some examples:
Tags from OverOps in SonarQube
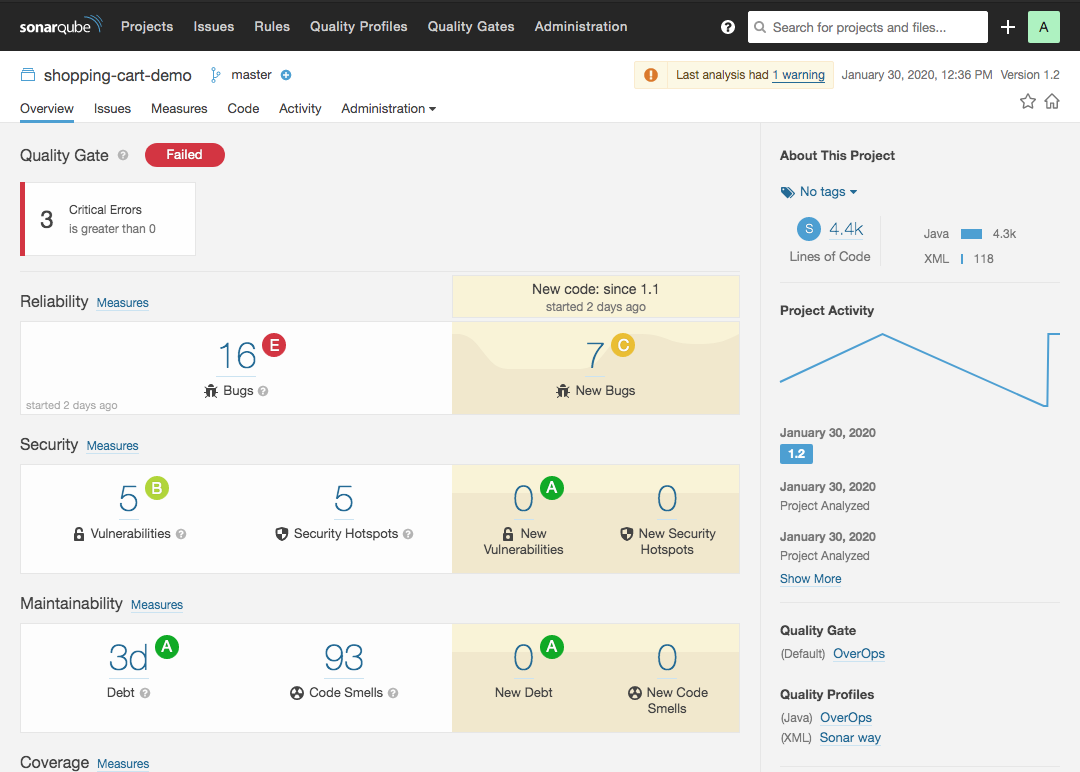
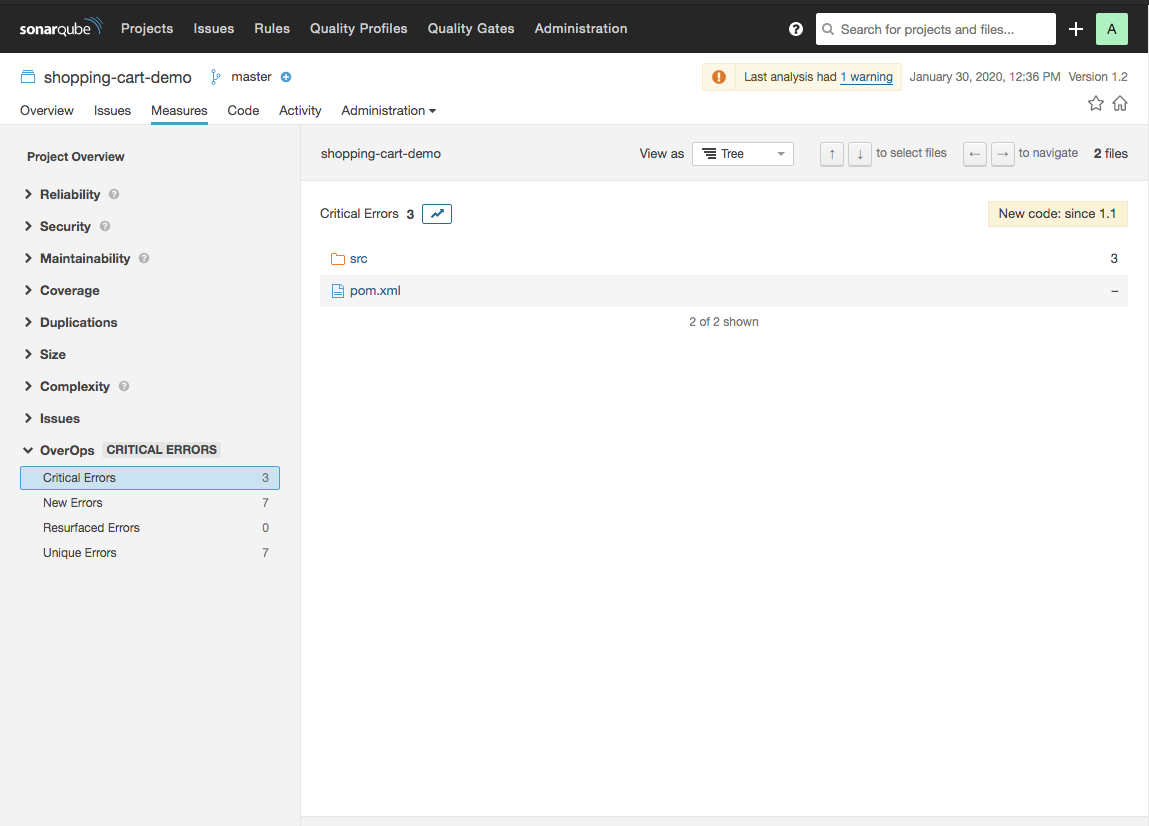
Measures from OverOps in SonarQube
Issues
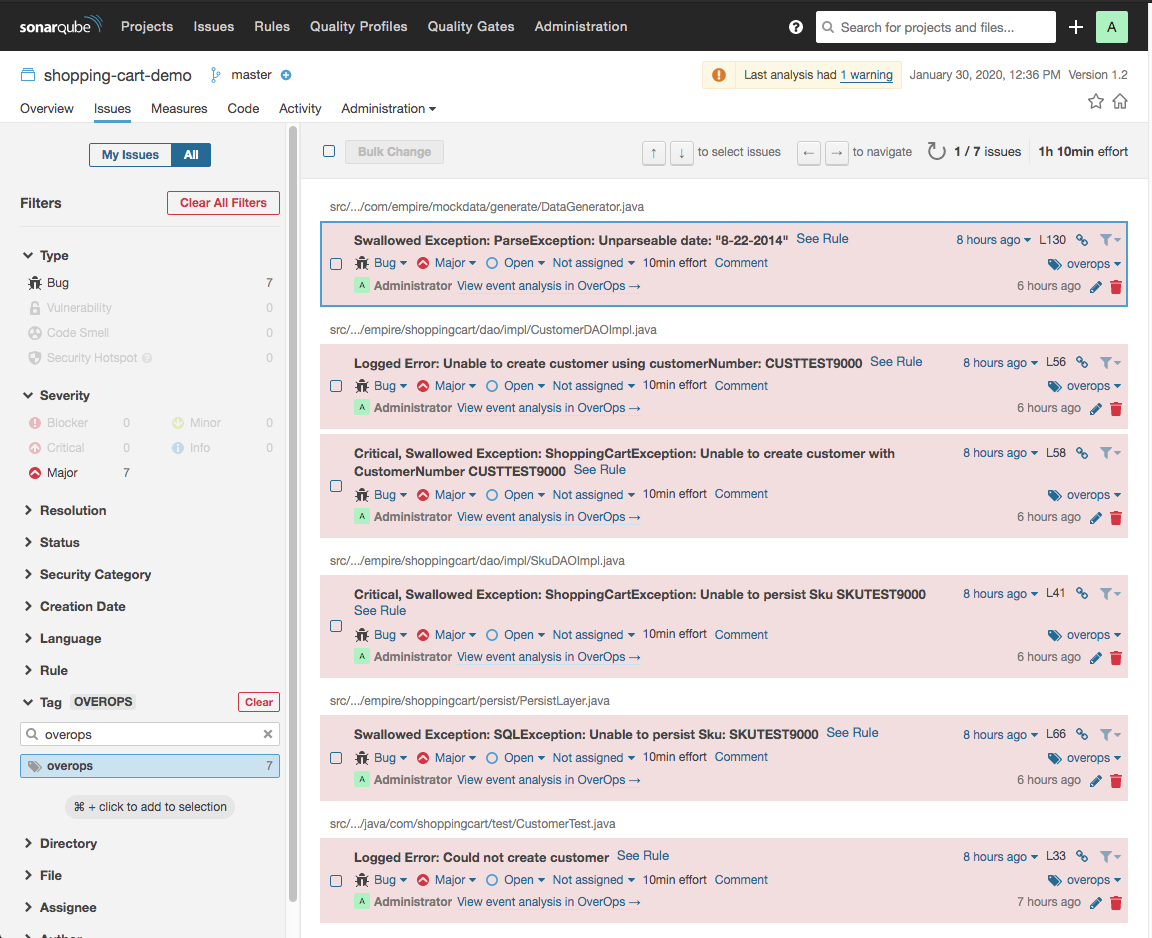
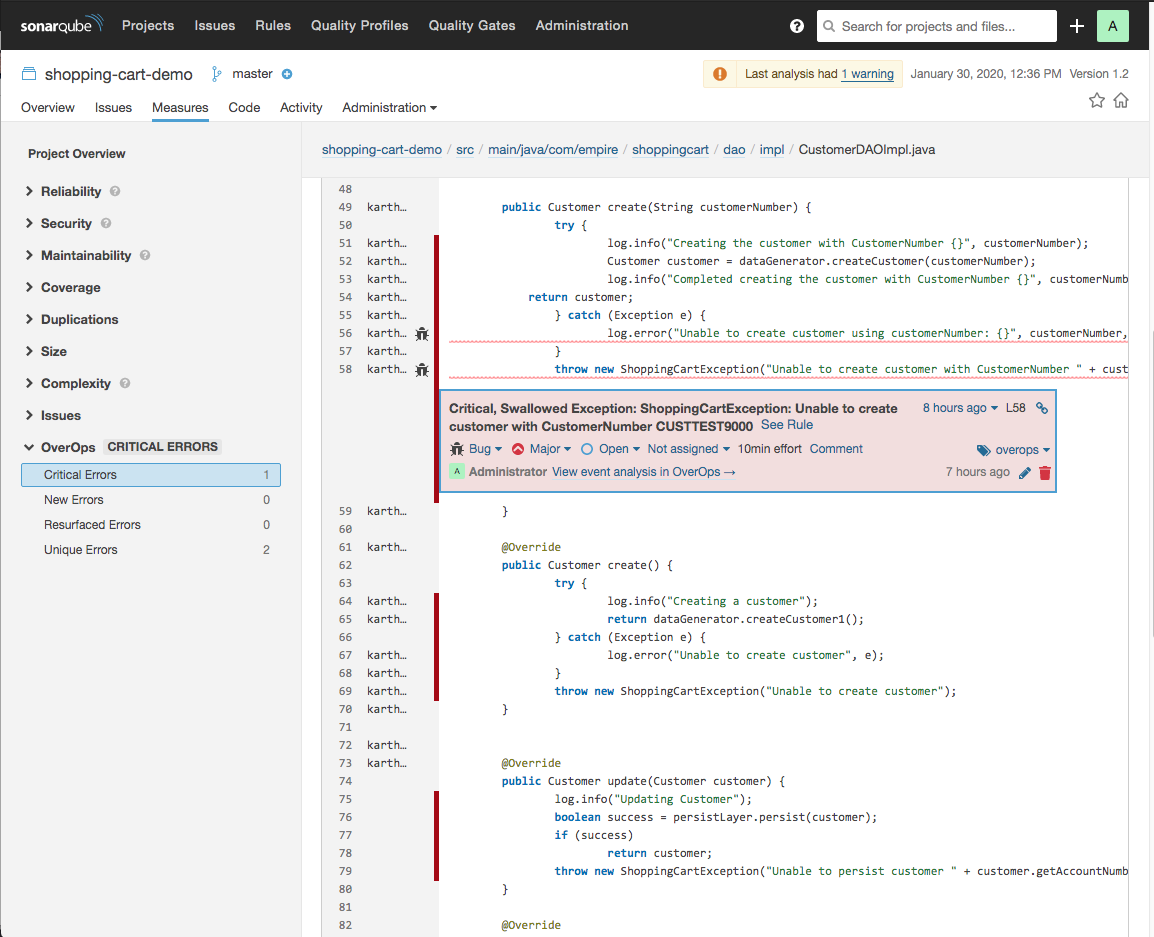
Issues with the following metadata are created for all OverOps events found for a deployment:
- Type - Bug
- Severity - Major
- Tag - overops
- Remediation Effort - 10min
For example:

Metrics
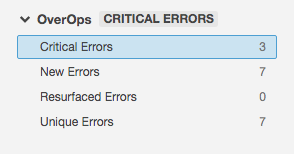
The plugin adds four metrics: Critical Errors, New Errors, Resurfaced Errors, and Unique Errors. The measure reported for each of these metrics shows the number of errors found in this deployment. The metrics are not mutually exclusive. A single error can be counted in multiple metrics. All errors are counted in the Unique Errors metric.
Updated 12 months ago
