Datadog
Datadog is a service that aggregates metrics and events across the full DevOps stack.
To populate Datadog with StatsD data, it should be delivered via the DataDog metrics aggregation service called DogStatsD. In addition to the instructions below, consult the DogStatsD documentation.

Obtain the DataDog License Key
To start with the DataDog trial key, go to www.datadoghq.com.
Install the DataDog Agent
Follow the instructions below to install the DataDog Agent.
We recommend that you install the Agent on the same machine as the OverOps collector.
Install the DogStatsD
DogStatsD is already included in the installation of the DataDog Agent, so all you have to do is turn it on and assign it a port.
Edit the datadog.yaml Configuration File
For Ubuntu:
sudo vi /etc/datadog-agent/datadog.yamlChange the following lines in the datadog.yaml file
# DogStatsd
#
# If you don't want to enable the DogStatsd server, set this option to no
use_dogstatsd: yes
#
# Make sure your client is sending to the same UDP port
dogstatsd_port: 8125
ImportantIf you connect not from the localhost, make sure you to set the
bind_host:property accordingly.
NoteMake sure Port 8125 is open before continuing.
Restart the DataDog agent
For Ubuntu:
sudo service datadog-agent restartPublish the OverOps Metric
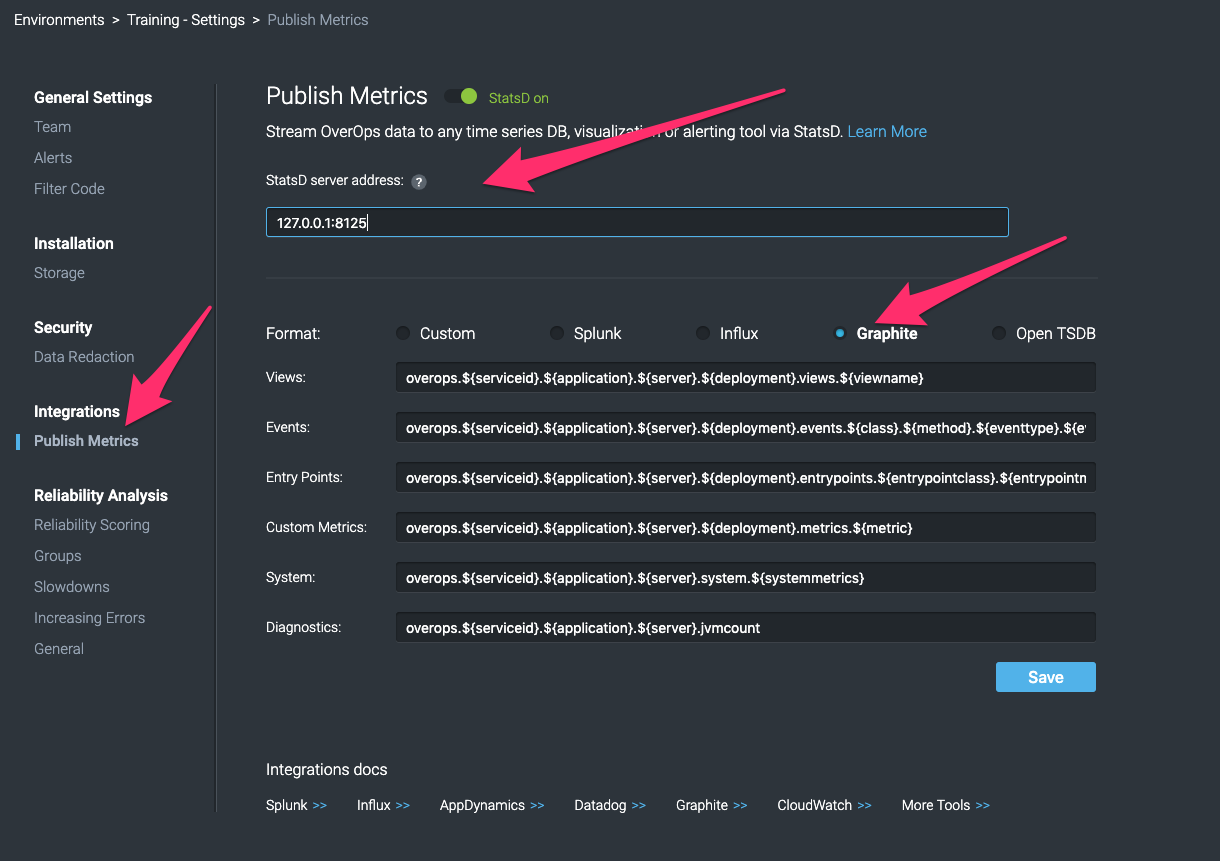
To enable publishing metrics from OverOps:
- Go to Settings and select Publish Metrics.
- Set the StatsD Server address accordingly.
- If installed on the collector. set it to the localhost.
Generate Metrics
Now run the Java application to which the OverOps Agent is attached to generate metrics.
Exploring the OverOps Metrics in DataDog
- In the DataDog toolbar, select Metrics --> Explorer.

- Select the Metrics to explore, and set the appropriate time windows in the Drop-down.

NoteOverOps also provides Automated Root Cause (ARC) for any event in Datadog using a tiny link injection.
Updated about 1 year ago