Introduction to Automated Root Cause
The OverOps Automated Root Cause screen provides a powerful mechanism to get to the root of errors and exceptions in production and staging environments. The page is divided into three panes, that provide information about the event to create a complete picture.

Automated Root Cause
Analytics Pane and Chart
The Analytics pane provides important details relating to the impact of this error on your application. It is divided into two areas: the Analytics pane and chart.
The Analytics pane provides the type of event, when it began and how many times its and out of how many calls. The Analytics chart shows you the volume of the event over the course of the selected timeframe (e.g. last hour,day, week,..). This enables you to filter the chart to display the volume of the event in specific applications and servers .
Click the Env or Server labels to directly to see the volume of the event on specifically on that machine or application. Hover over the occurrences label to see the number of times this event has occurred and out of how many calls into the method containing it.
Click Open in Dashboard at the top-right of the screen to open this event in the main Event Explorer. Click Go to snapshot on any point in the graph to jump and see the code and variable state at that moment in time.

The Analytics Pane (left) and the Event Chart (right) displaying the volume of the error
Analytics Pane
The Analytics pane provides an at-a-glance view of the snapshot status:
Resurfaced Events
When an event resurfaces in the ARC screen, you'll see an indication on this in the upper left corner. This will let you know when a previously resolved event has resurfaced so that you'll know it should be given more attention.

Snapshot
OverOps captures data when events, application errors (exceptions) and log (warnings and errors) occur according to a defined algorithm.
The OverOps snapshot contains valuable information about events in the monitored application, including:
- The date and time the snapshot was taken
- The server and application on which the event occurred
- The deployment on which the event was recorded (details where the event was first seen and where the snapshot was taken)
- The full Call Stack
- The Source Code view.
From version 4.13.1, when there are multiple web applications running on the same environment (Env), the snapshot includes the web application name in which the event was caught:

Although the information in these snapshots may be crucial to fix the problem causing the event, the number and frequency of these snapshots can impact performance. There are ways to reduce this impact.
The Collector's throttling mechanism enables mitigating the number of snapshots to reduce overall storage and optimize environment performance. To enable throttling, see: Collector/Storage Optimization
In certain cases it may be required to take a snapshot in addition to the snapshot algorithm.
To force a snapshot for the next time an event occurs:
- From the Event Explorer Event List, click the
 and select Force Snapshot.

The snapshot is recorded the next time the event is seen in the application.
OR
- From the ARC screen, in the left pane, click
 .
.

The time of the last snapshot is displayed and you can scroll between previous snapshots with the ![]() back arrow.
back arrow.
For events that are associated with specific App-Tiers labels then the Application-Tier name or names (for multiple tiers) will also appear in the Event details pane.
Call Stack
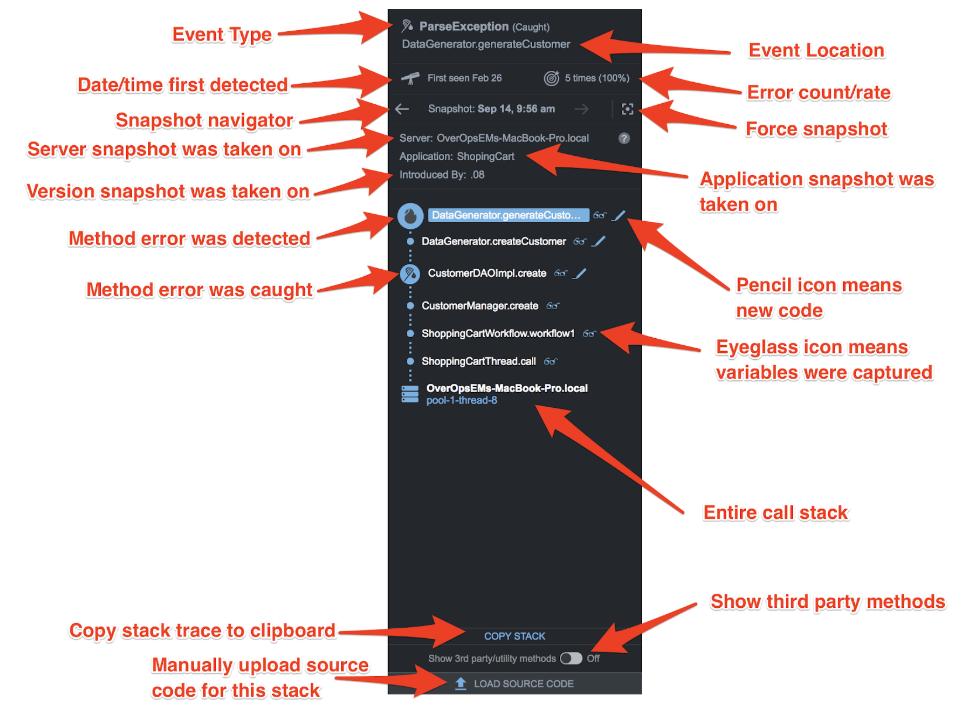
To understand and resolve errors, it is important to be able to trace their path through the code. In the Automated Root Cause screen, OverOps reveals the full call stack - from entry point to the method in which the event occurred - even across multiple machines.
The call stack for an event is displayed on the left hand side of the ARC screen. OverOps tracks the code and variables state for the event all the way back to its entry point into the code, where the parameters were passed into it. If the event involves calls across multiple machines, OverOps displays a unified call stack. Click on a method in the call stack to open it on the right hand side.
The Call Stack pane displays the chain of methods within the environment leading up to the event. The first method in line is the last method on a non 3rd Party code within your application. The  icon in the method indicates that the variable state has been detected by the environment micro-agent.
When an exception is caught and re-thrown once or more within the thread, Related Errors drop-down displays the error analysis (available only when such exceptions exist).
At the bottom of the stack the machine name and the environment thread name in which this error occurred are displayed. By default, 3rd party code is hidden. To display them, from the bottom of the stack, turn Show 3rd party methods on. To copy the full stack to the clipboard, click COPY STACK.

Unified Call Stack

Call Stack pane
Method Summary
When hovering over the i icon in the ARC screen, the Method summary popup includes the following information:
Class version - For example '52.0'.
 Source file name - For example ‘class.java’ or ‘class.scala’.
Cart Status: Full / Available
 a link to our documentation on how to control the cart size
* [Optional - will appear if relevant]: an indicator that will notify you when not all variable states were captured (due to size limitations, see cart size above).

Method Summary
Source Code View
By default, the Source Code View shows a decompiled Java version of the bytecode executing within the VM at the moment of event. Hover over any highlighted variable to display its value and jump to see its full contents within the variable grid. The row in which the event occurred is highlighted, as depicted below, while the full event message appears in the title of the code pane.
When configured, OverOps uses the original source code instead of decompiling it from the VM.
Search the source code or the variable grid for any variable name or value using Search Variables. Click here to learn more about variable search.

Source code and Variable state pane
- To view information about the decompilation per method, open the Event ARC screen and hover over the
 icon beside the method name.
 - To add the latest source code, from the bottom of the Call Stack, click Load Source Code (admins only).
- To refresh the source code from the OverOps database, click Refresh All Sources (admins only).

OverOps doesn't Support Obfuscated CodeOverOps doesn't support obfuscated code that can’t be decompiled (or when decompiled generates garbage). Therefore, in these cases, the best practices is to attach the object source.
Decompiling Raw Java BytecodeThe source code in the Source Code View is generated by decompiling the raw java bytecode, which creates differences between your actual source code and the source code shown in the Source Code View. For example, annotations and comments in your source code will not be visible in the Source Code View.
To minimize the difference between the original source code and “clean” decompiled sources, from version 4.39.1*, we’ve introduced decompilation enhancements that use raw bytecode sent from the Collector to the backend before decompilation. These enhancements will apply automatically to new methods that haven’t been decompiled before.
Applying the Decompilation Enhancement Manually - Admin Users Only
- To apply the decompilation enhancement manually (for example for existing methods), open an event in the ARC screen.
- Go to the bottom left corner of your screen and click Refresh All Sources. This will apply the decompilation enhancement for the methods in this event only.

Disabling the Raw Bytecode Option
The option to send raw bytecode is *enabled by default" and requires your Collector and backend to be upgraded to 4.39.1.
To disable the option for sending raw bytecode:
- Click the Environments dropdown list and select Installation Keys.
- In the Installation Keys dialog, click the plus (+) sign next to your installation key, and then scroll down until you reach the checkbox Enable enhanced decompilation (this will use raw bytecode but won't store it, requires Collector restart, supported in version 4.39.0 or above).
- Clear the checkbox.
- Restart the Collector.
How to Recognize Methods that have the Decompilation Enhancement Applied
Open the Event ARC screen and hover over the ![]() icon beside the method name.
icon beside the method name.
The Method Summary window shows you the decompiler name and the source origin. If the source origin displays a plus (+) sign, this means the enhancement has already been applied and you don't need to apply it.

Method Summary - Decompiler Status
Force Decompilation
The ARC screen utilizes the existing source code to obtain the information on the event. However, when there's no source code available - or if the source code has changed and needs to be updated - the ARC screen provides you with the option of refreshing the sources (if you uploaded sources the latest ones will be presented; otherwise the code decompilation result currently being used will be presented).
- To use the force decompliation feature, you'll need to make sure that the Collector is up and connected, since that's where the ARC will take the latest sources or the new sources.
- Go to the bottom left corner of your screen and click Refresh All Sources.

The screen will display a "processing" icon, and then when done, you'll receive a notification that the source code was decompiled.
3. Refresh the browser to display the change to the code.
4. If you want to decompile the source code using a specific decompiler, use the following procedure:
4.1 In the ARC screen URL, add the following to the end of the URL:
forcesourcedecompilation=true&decompiler= and then specify one of the following decompilers:
- procyon
- cfr
For example:
forcesourcedecompilation=true&decompiler=procyon
4.2 Press Enter, and then refresh the browser.
Object and Variable State
Recorded Variables displays the variable values and objects accessible from the method. Objects can be explored up to ten levels deep into the code. Click the  button that appears when hovering over the object, to view its contents as a JSON. The content can be copied to the clipboard.
The Recorded Variables pane contains all local variables and parameters (including "this" in non-static methods). The first method also contains thread-local variables defined for this thread as well as SLF4J and Log4J Mapped Diagnostics Context (MDC) values. These MDC objects are often too large, for the full set of data to be available in the log, the micro-agent, however, is able to capture and record the entire object.
In some use cases, such as asynchronous message passing, these MDC objects contain a key-value map of the recorded requests, initial servlet information, and much more. They can be seen in any OverOps snapshot, and provide better visibility to the source of the bad request. This provides helpful extended visibility feature since back tracing the source of a bad request in an asynchronous environment is a known challenge.
The choice of the collected variables most relevant within an allocated timeframe is determined by the Agent using an adaptive machine learning algorithm. The selection process involves which and how many variable to collect, the number of items to collect, the length of string to capture, etc.
Click here to learn more about object and variable state.

Log View
The Log View displays the last 250 log statements leading up to the event. Since the log statements are collected directly from JVM/CLR memory, any DEBUG, TRACE or INFO statements are visible regardless of whether or not they were logged to file.
Click the  button to switch between code and log view.
Click here to learn more about the Log View.

Log View pane
Env View
For each event and exception detected, OverOps displays an Env view that displays the internal environment state at the moment of the event, including memory usage (heap and non-heap), basic system information, CPU usage and more. This enables working with the OverOps code (“classic”), log and Env data without leaving the application. Click here to learn more about the Env View.

Actions Toolbar
The Actions toolbar provides a set of capabilities to share, mark and search through the error analysis contents:

Actions include:
- Send to Jira - Create a new Jira issue for an event linking it directly to the source, stack, state and statistics.
Click here to learn more about Jira integration. - Delete - Remove the event from the Event Explorer Events List and Chart. The Agents no longer capture snapshots for this event. The event will appear under the "Archive" label in the Event Explorer from which it can be resolved.
click here to learn more about hiding errors. - Resolve - Mark an event as fixed and remove it from the Event Explorer Events List and Chart. Should this event occur after a new code deployment, it will return to the Event List and Chart marked 'Resurfaced', and you'll be notified by email.
click here to learn more about resolving errors. - Label - Label events to classify them according to priority ('Critical' or 'Low'), responsibility ('John' or 'QA') and version ('V1 RC2').
Click here to learn more about creating and assigning labels. - Add/Edit Note - Attach a note to an event and share it with your team members about which they are notified by email.
Click here to learn more about sharing with team members. - Add Timer - Track predefined methods for latency. OverOps sends an alert when the code runs longer than expected.
Click here to learn more about Timers.
ARC Chart
Visualizing events greatly improves understanding of it. In each tale, OverOps displays a graph of to give a sense of its frequency and indicate on which servers or applications it is occurring.
The ARC Graph
The ARC graph is similar to the Event Explorer graph, but displays only data for the specific event.

ARC Graph
Within the graph, you can set the timeframe view and the Servers/Applications view. For example, to check how many times the event occurred on a specific server in the last day in the graph, select the relevant views at the the top of the graph pane.
From the top right of the graph, click Open in Dashboard to display the event in the OverOps dashboard. This is particularly useful if you arrived at the event trend from outside OverOps, such as the log files.
Related Events
Events are often connected to other events occurring in the code. OverOps automated root cause points to related events.
If an event has caused re-throws or has other events related to it, a Related Events drop-down menu appears in its Automated Root Cause screen. Click to list all the related events and re-throws, as well as their type (caught or uncaught exception, HTTP error, or log error). The currently displayed event is indicated in bold.

Related Events and re-throws in Automated Root Cause
Related Articles
Updated about 1 year ago