Filtering Exceptions
Introduction
Filtering is one of the most powerful tools for finding critical exceptions in OverOps. Using filters, you can easily view relevant and important errors in your production code.
There are four controls to enable filtering, grouping and searching events in the event list.
- Timeframes - see Filtering Events per Timeframe for details
- Server/Application/Deployment
- Event Grouping
- Event List Filters

Filter by Server/Application/Deployment
Use this filter to view errors and exceptions originating from specific server/machines or from specific applications. For example, let’s say you only want to view errors coming from your production servers, you can open the Server filter, search for “prod”, then select all production servers and click Apply.
You can choose to include filters from all three options, and then click Apply to apply all your selections.

Filter by Application/Deployment/Server
NoteOverOps automatically recognizes the default name of the server, but servers can be named within OverOps. Click here to learn how.
To view exceptions thrown from a specific application running on servers monitored by OverOps, regardless of the server it was thrown in, use the Application filter. Name the application – Click here to learn how. to filter and view relevant event data.
To include non-active options, slide the slider for "Show active apps/deployments/servers only" to disable it. This will then display the non-active items for that tab.
Event Grouping
OverOps enables you to group events by Applications, Server and Deployments to allow you to gain a broader picture of application stability and reliability. These groupings enhance your top-to-bottom drill-down work-flow, starting from the widest point-of-view and quickly and elegantly streamline towards critical errors and exceptions.
This allows you to move directly from an Ops role where you look for spikes, anomalies and introduction of new errors into your environment, to a developer role focused on fixing the issue.
By default, the Dashboard event list is grouped by events, in which each row represents a different event. Choosing a different grouping mode will change the events list focal point from error-based to server or application-based.
To change the grouping mode:
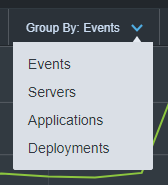
- From the Event Chart toolbar, click the Group by drop-down list and select the group (Events, Servers, Applications, Deployments):
Grouping by Applications
This grouping displays the same Events List grouped into applications - each row represents a specific application with all relevant information attached.

Grouping by application gives an insightful environment overview, providing a comprehensive analytic workflow. Clicking any row switches back to the event-based list filtered by the chosen application/server.
To open filtered events:
- From the Events List toolbar, click + and select Multi Select.
- From the Applications list, select the applications to display.
- From the Event Chart toolbar, Show Events.
The selected events that match all the selected filters are displayed in the Events List.
Deployments
The Deployments grouping behaves similarly to the Operations.
- Choosing Deployment to Group by displays the different deployments in each row.

- Select one or more deployments, click New Events to display newly introduced events within the selected deployment(s).
Unlike Operations, deployments require that you set up each deployment prior to using the grouping. For more information, click here.
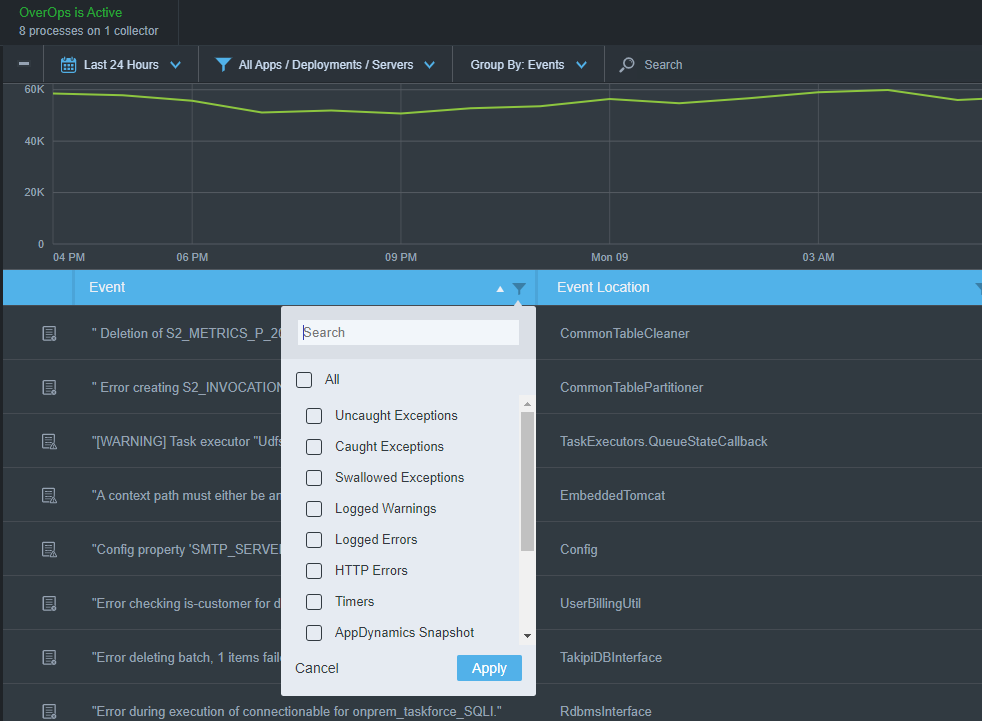
Event List Filters
From the Event List you can select different attributes to filter events; refer to the Event List for details.
Related Articles
Updated about 1 year ago