Introduction to the Event Explorer
Introduction
The Event Explorer is a hub for catching, prioritizing and fixing critical errors in your staging and production applications.
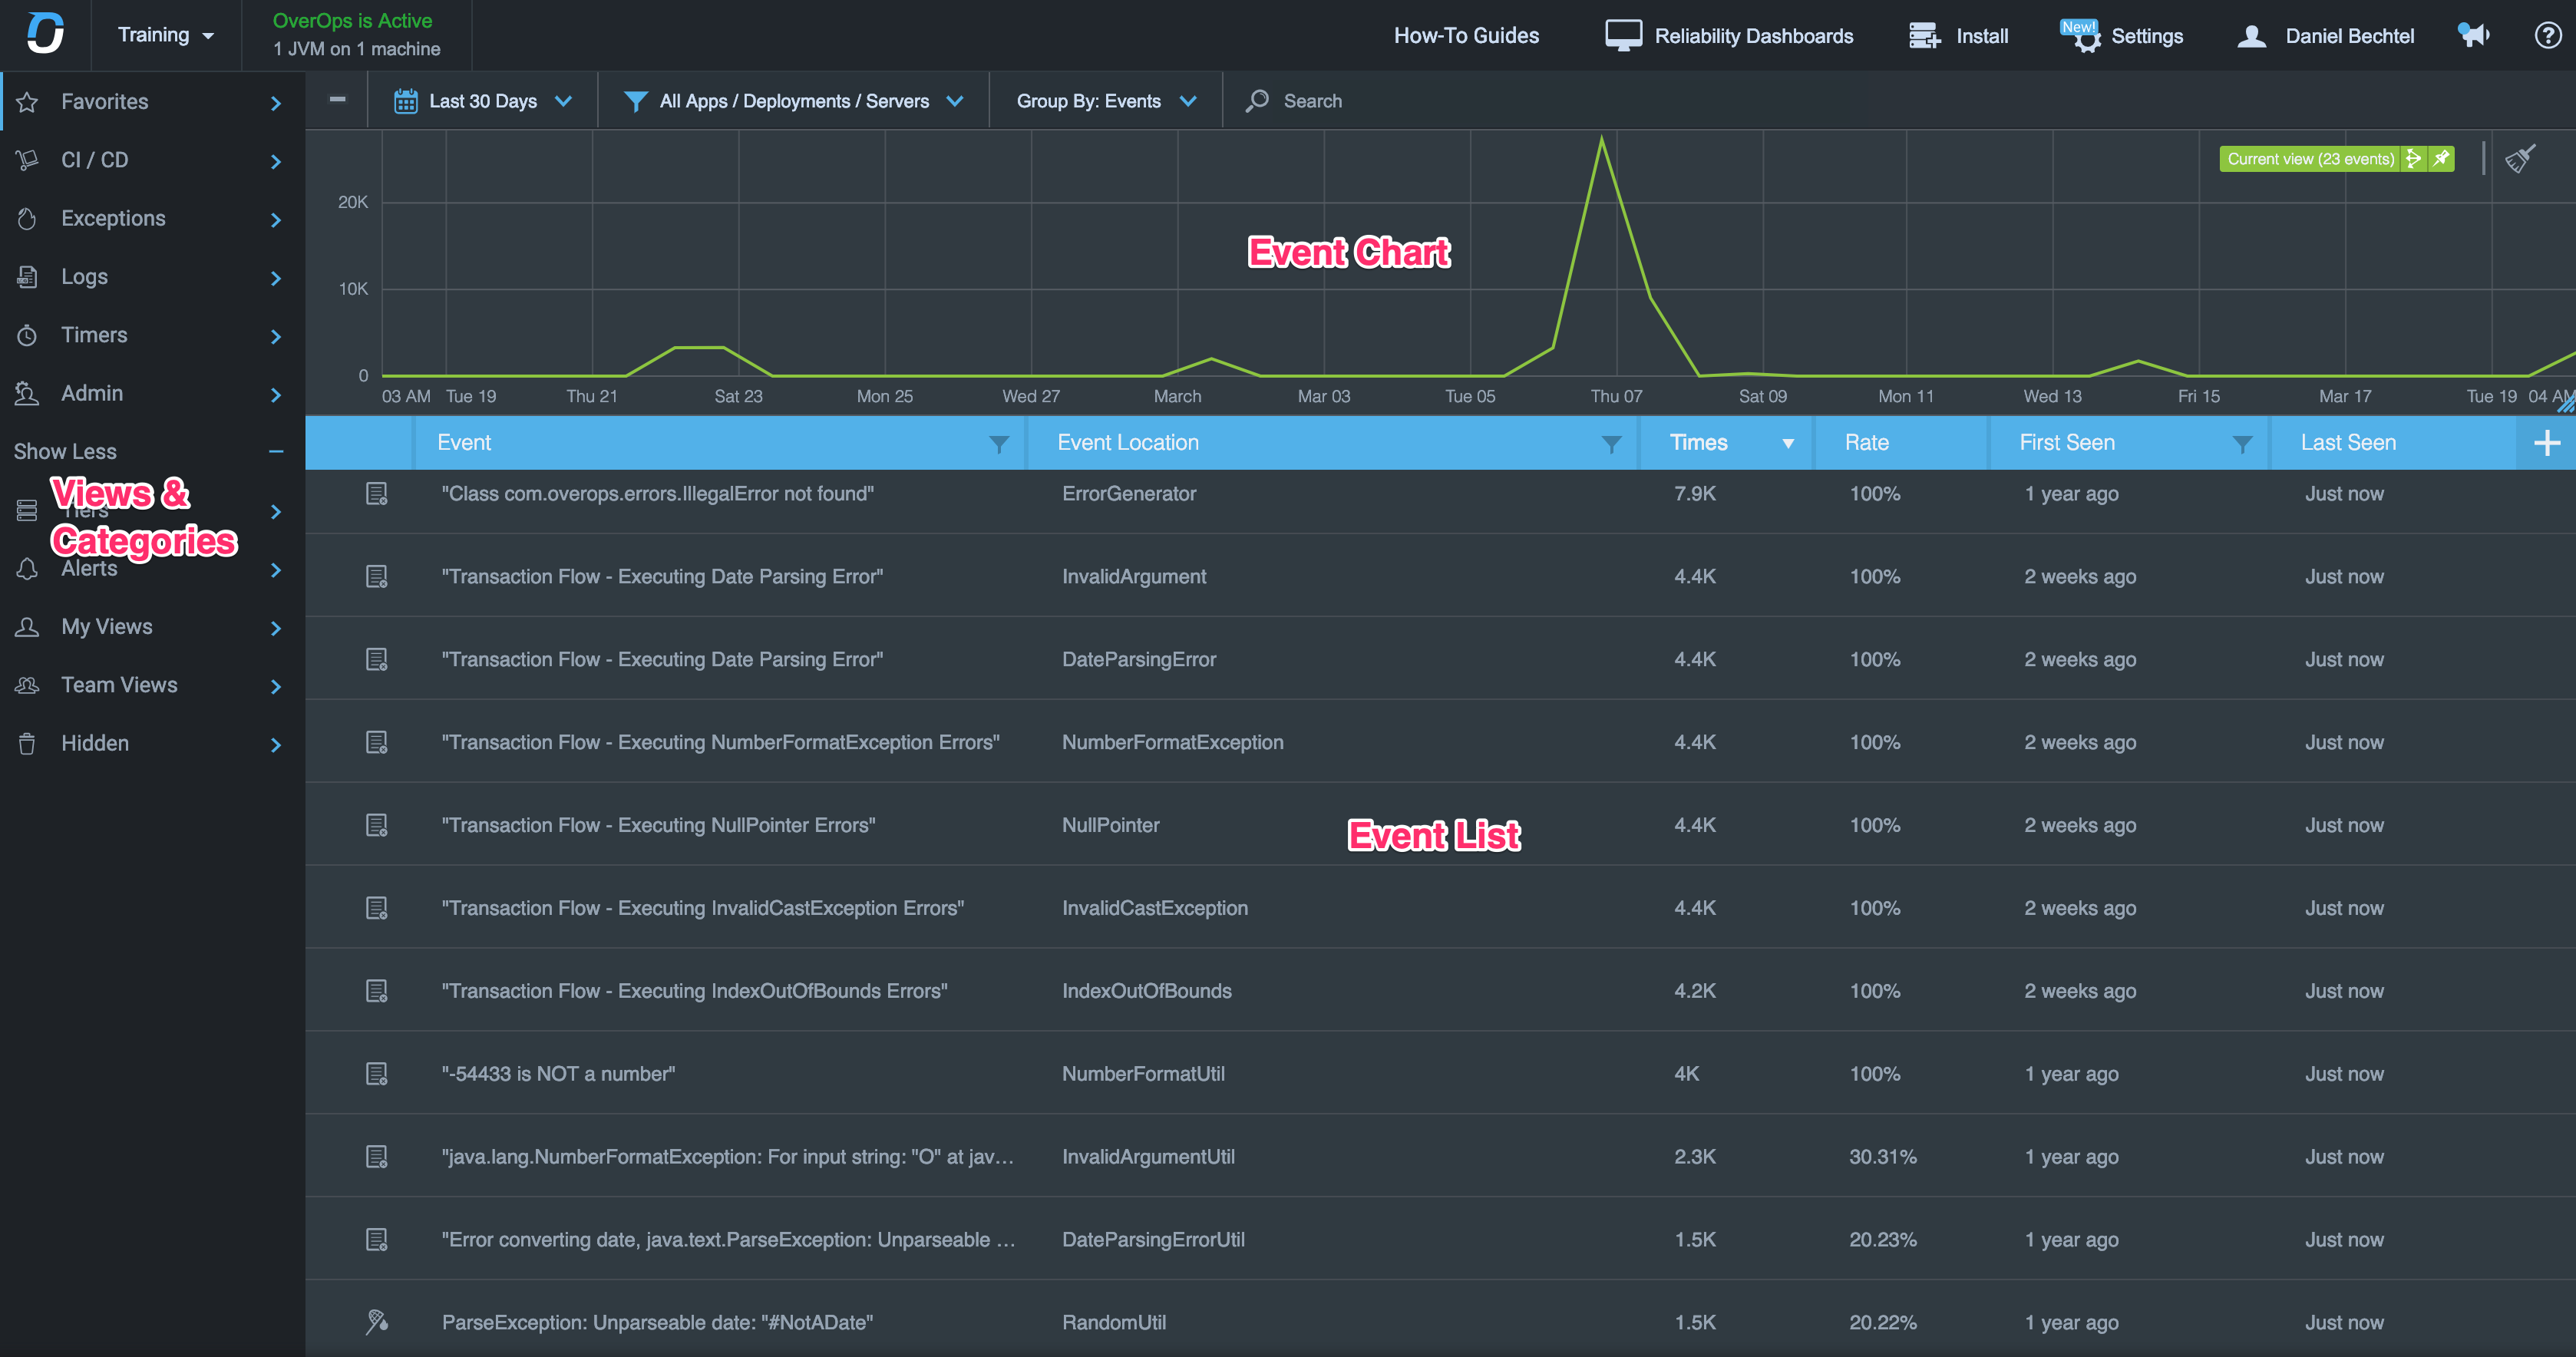
The Event Explorer is comprised of three main panes - Event List, Event Graph, and Views Pane. Together these components allow you to determine which error is impacting your applications the most. Once you've zoomed in on an error, you can drill into its actual cause using the Automated Root Cause (ARC) Screen.
The Events List and Graph both visualize the events captured within the selected set of filters that affect the list:
- Events shown within the Event Explorer include Exceptions (caught, uncaught and swallowed), Log Errors and Warnings, HTTP Errors, Timers and Custom event.
- Events within Event Explorer are always viewed within the context of a timeframe and View.
ImportantThe following events are currently supported only on the JVM languages listed here:
- HTTP Error = HTTP communication errors
- Timer = Events that exceeded thresholds configured under Timers
- Custom Event = Events that occur in the custom SDK
Events List
The Event List uses a grid-like UI to show you an ordered list of all the events within the current timeframe and view. Each row in the grid describes a deduplicated event and provides deep contextual information as to its type, location in the code and impact in terms of volume and spread across your application.
Click an Event in the list to open the last snapshot for that event, captured closest to the end of the current timeframe (e.g. if you are looking at the "Last hour" timeframe, clicking an event in the list will open the most recent snapshot captured for that event).
The Events List enables you to sort and filter through data to get to the event that impact the application.

Event List
Events Graph
Another key component in the Event Explorer is the Event Graph. The graph interactively visualizes the volume of the events included within the current timeframe and view. These are visualized through the Current View series (in green). Filtering events within the grid is automatically reflected in the graph to visualize the events currently viewed.

Event Chart
Setting Timeframes
The information in both the Events List and Graph is always reflected in the selected timeframe. Use the timeframe picker to select the last hour/day/month or a custom time window. For more information, see Filtering Events per Timeframe
Refreshing the Event List Automatically
The Event List is refreshed automatically to display the latest information. You can change the refresh interval rate in the Time Picker Dialog by selecting the "Refresh even list every:" dropdown (the default is 5 minutes):

Refresh interval
Categories
Categories (represented by folders) contain the different Views that are used for focusing on events in applications. Categories are used to facilitate data management, and can hold different types of views.
Views
Views provide you with a simple mechanism for focusing on specific types of events in applications. Views are comprised of any combination of grids and graphs, such as columns, sorting options, applications, servers, deployments, and timeframes. These can be saved as a reusable View that you can reuse to monitor specific aspects of your application and share with your team.
The Event Explorer provides a set of out-of-the-box filters that enable you to see the new errors that were introduced today, this week, the number of errors over last hour or day, and more.

Views Pane
Labels
Labels are a key feature in both Views and Tiers (App Tiers, Code Tiers), enabling you to tag specific errors with meta labels such as 'Critical', 'Low Priority' or 'Testing' to enable you and your team to tag and annotate specific kinds of errors.
Updated about 1 year ago