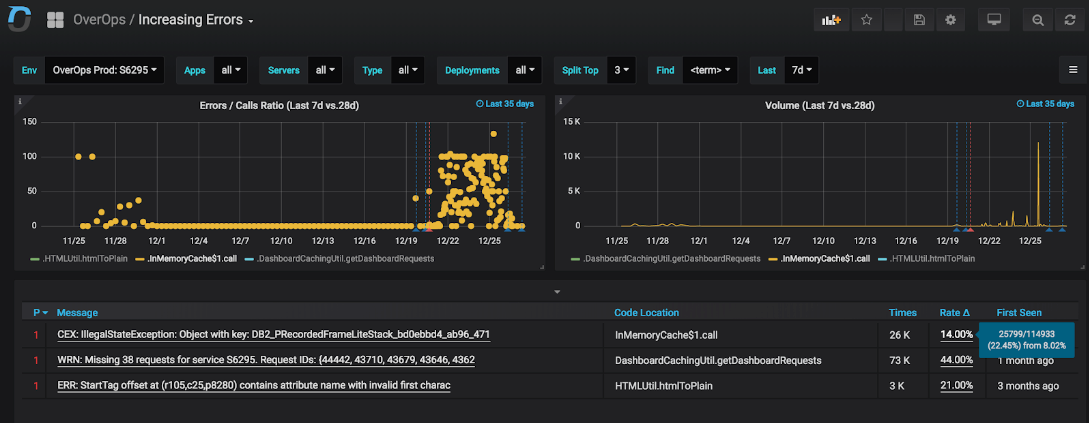
Increasing Errors
Introduction
The Increasing Errors dashboard shows errors that have increased in rate (i.e. regressed). Rate is defined as the ratio between the event volume and calls into the method in it occurred. As a loop may be placed in the event's location, an error may occur more than once per invocation of the event containing it (e.g. a loop in which errors are thrown and caught / logged). This means the ratio can be greater than 1.
Learn how OverOps Calculates the Reliability ScoreClick here for a visual overview of the OverOps dashboards, and the way they all connect to provide QA, DevOps and SRE teams a complete picture of application reliability across multiple environments.

The left graph shows the rate of regression with highest volume. The right graph shows their absolute volume (e.g. the number of times they occurred).
An error is considered to have regressed if its rate in the current timeframe has increased by more than the regression_delta value defined in the Settings Dashboard. The error is considered to be critically regressed if its rate changed by more critical_regression_delta percent, as defined in the Settings Dashboard. The rate is used to calculate regression vs. absolute volume to compensate for any changes in throughput within elastic environments or different time windows in which an error may happen (e.g. Black Friday vs. normal weekend).
For example, if an event that used to happen with an error ratio of 0.2 (1 error per 5 invocations of the error’s containing method) in the baseline time frame and is now happening at a ratio of 0.3 (3 out of 10 calls), its rate has increased by 50%. If the regression_delta value in the Settings dashboard is set to 0.5 then the error would be considered to have regressed.
For an error to be considered either a severe or non-severe regression, it must also occur more than the value of the error_min_volume_threshold field in the Settings dashboard. For example, if that value is set to 100, the event must occur more than a hundred times within the selected timeframe for it be considered for regression analysis. The error ratio within the current timeframe must also exceed the value of the error_min_rate_threshold. For example if that value is to 0.2, the error rate of that event within the current time frame must exceed 0.2 (more than 1 error per 5 invocations) for the event to be considered a regression.
Clicking each error name in the table will jump to the OverOps Automated Root Cause (ARC) analysis for this error that will show exactly the complete state of the event at the moment where it exceeded the threshold. This enables developers and SREs to see the actual state within the application that caused that error to understand whether the cause of the error is code or infrastructure related.
Increasing Errors Dashboard JSON ModelCustomize the dashboard, or integrate any of the widgets in it into your Grafana using the Grafana JSON Model of this dashboard.
Updated 12 months ago
